BANGKOK- Thai AirAsia (FD), Thailand’s leading low-cost carrier, operates an extensive network with Bangkok (BKK) serving as its primary hub for both domestic and international connections.
Top 20 busiest routes of Thai AirAsia (FD), dominated by domestic services, showcase its strong market presence throughout Thailand while highlighting selective international destinations across Southeast and East Asia.
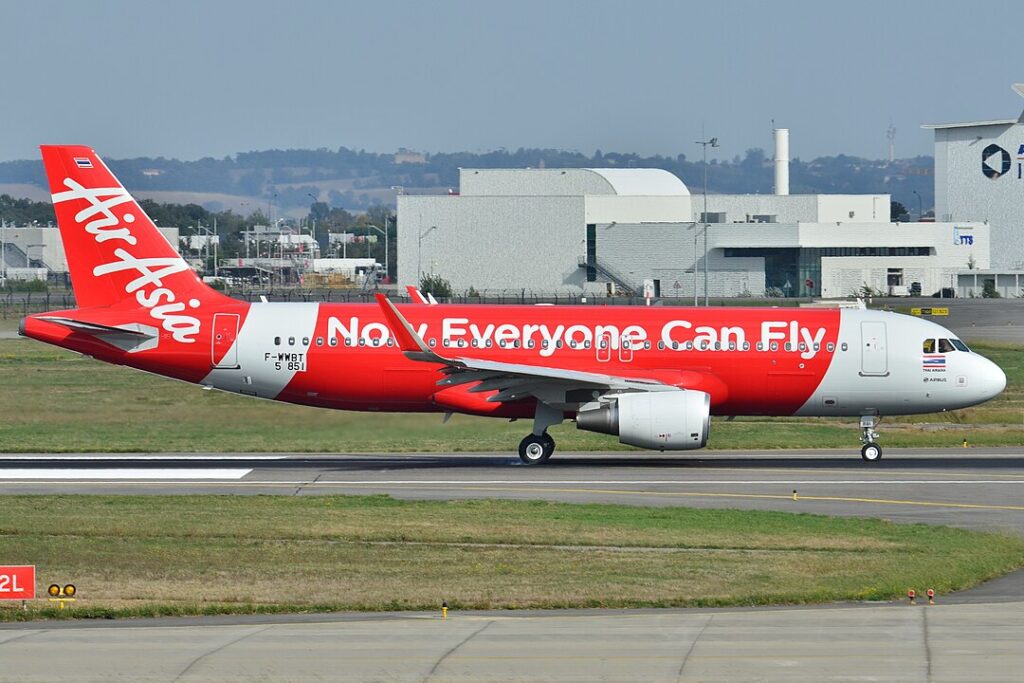 Photo: By Laurent ERRERA from L’Union, France – DSC_8385-F-WWBT – MSN 5861, CC BY-SA 2.0, https://commons.wikimedia.org/w/index.php?curid=29837664
20 Busiest Routes of Thai AirAsia
An AvBench analysis of Thai AirAsia (FD) top 20 busiest routes provides valuable insights into the carrier’s market position and strategic focus.
The data reveals that Bangkok-based operations dominate the airline’s network, with all routes except one (Chiang Mai-Phuket) originating from the Thai capital.
This hub-centric approach has allowed Thai AirAsia to maintain significant market share across its domestic network while showing vulnerabilities in some international markets.
| 1 | Bangkok – Chiang Mai | 4,233,333 | 39% | 1,651,000 | 5.2% |
| 2 | Bangkok – Phuket | 4,476,471 | 34% | 1,522,000 | 2.5% |
| 3 | Bangkok – Hat Yai | 2,173,513 | 37% | 804,000 | 2.9% |
| 4 | Bangkok – Krabi | 1,340,426 | 47% | 630,000 | 1.9% |
| 5 | Bangkok – Khon Kaen | 1,225,641 | 39% | 478,000 | 3.8% |
| 6 | Bangkok – Chiang Rai | 1,632,143 | 28% | 457,000 | 1.3% |
| 7 | Bangkok – Surat Thani | 1,097,368 | 38% | 417,000 | 6.2% |
| 8 | Bangkok – Udon Thani | 1,453,846 | 26% | 378,000 | 4.5% |
| 9 | Bangkok – Singapore | 2,769,231 | 13% | 360,000 | -5.3% |
| 10 | Bangkok – Hong Kong | 2,618,182 | 11% | 288,000 | 3.4% |
| 11 | Bangkok – Nakhon Si Thammarat | 925,806 | 31% | 287,000 | 6.1% |
| 12 | Bangkok – Nakhon Phanom | 268,000 | 100% | 268,000 | 9.4% |
| 13 | Bangkok – Roi Et | 267,000 | 100% | 267,000 | 0.0% |
| 14 | Bangkok – Ubon Ratchathani | 1,140,909 | 22% | 251,000 | 1.9% |
| 15 | Bangkok – Phitsanulok | 425,424 | 59% | 251,000 | 11.3% |
| 16 | Chiang Mai – Phuket | 504,082 | 49% | 247,000 | 0.2% |
| 17 | Bangkok – Da Nang | 592,500 | 40% | 237,000 | 2.6% |
| 18 | Bangkok – Nan | 370,313 | 64% | 237,000 | -2.4% |
| 19 | Bangkok – Ho Chi Minh City | 1,072,727 | 22% | 236,000 | 0.4% |
| 20 | Bangkok – Macau | 418,868 | 53% | 222,000 | -4.2% |
1. Bangkok (BKK) – Chiang Mai (CNX)
- Passenger Volume: 4,233,333
- Market Share: 39%
- Thai AirAsia Passengers: 1,651,000
- YoY Growth Rate: 5.2%
This high-demand domestic route connects Thailand’s capital with its cultural heart, Chiang Mai. The route remains one of Thai AirAsia’s busiest, benefiting from strong tourism and business travel.
Growth continues at a steady pace, fueled by increasing domestic tourism and a stable economy.
2. Bangkok (BKK) – Phuket (HKT)
- Passenger Volume: 4,476,471
- Market Share: 34%
- Thai AirAsia Passengers: 1,522,000
- YoY Growth Rate: 2.5%
As one of Thailand’s top tourist destinations, Phuket sees significant passenger traffic year-round.
However, competition from other carriers and alternative travel options slightly slow market share growth. AirAsia continues to dominate the low-cost segment, maintaining a leading position.
3. Bangkok (BKK) – Hat Yai (HDY)
- Passenger Volume: 2,173,513
- Market Share: 37%
- Thai AirAsia Passengers: 804,000
- YoY Growth Rate: 2.9%
This southern Thailand route is crucial for both business and leisure travelers. Despite moderate growth, passenger demand remains consistent, supporting the overall network stability.
4. Bangkok (BKK) – Krabi (KBV)
- Passenger Volume: 1,340,426
- Market Share: 47%
- Thai AirAsia Passengers: 630,000
- YoY Growth Rate: 1.9%
Krabi’s appeal as a beach destination drives passenger volume, but seasonal fluctuations impact yearly growth.
Thai AirAsia (FD) holds a dominant position on this route, reinforcing its regional strength.
5. Bangkok (BKK) – Khon Kaen (KKC)
- Passenger Volume: 1,225,641
- Market Share: 39%
- Thai AirAsia Passengers: 478,000
- YoY Growth Rate: 3.8%
A key route serving northeastern Thailand, Bangkok to Khon Kaen supports a mix of business and personal travel. Increasing economic activity in the region fuels passenger growth.
6. Bangkok (BKK) – Chiang Rai (CEI)
- Passenger Volume: 1,632,143
- Market Share: 28%
- Thai AirAsia Passengers: 457,000
- YoY Growth Rate: 1.3%
This route serves Chiang Rai, a gateway to northern Thailand’s scenic landscapes. Demand remains strong, particularly during peak travel seasons.
7. Bangkok (BKK) – Surat Thani (URT)
- Passenger Volume: 1,097,368
- Market Share: 38%
- Thai AirAsia Passengers: 417,000
- YoY Growth Rate: 6.2%
Surat Thani provides access to Koh Samui and other Gulf islands, making it a vital route. Strong growth indicates rising interest in alternative travel hubs.
8. Bangkok (BKK) – Udon Thani (UTH)
- Passenger Volume: 1,453,846
- Market Share: 26%
- Thai AirAsia Passengers: 378,000
- YoY Growth Rate: 4.5%
With Udon Thani being a key business and travel hub near the Laos border, this route remains critical for regional connectivity.
9. Bangkok (BKK) – Singapore (SIN)
- Passenger Volume: 2,769,231
- Market Share: 13%
- Thai AirAsia Passengers: 360,000
- YoY Growth Rate: -5.3%
Declining numbers highlight strong competition in the Bangkok (BKK) – Singapore (SIN) sector, potentially impacting market share.
10. Bangkok (BKK) – Hong Kong (HKG)
- Passenger Volume: 2,618,182
- Market Share: 11%
- Thai AirAsia Passengers: 288,000
- YoY Growth Rate: 3.4%
Despite being a major international route, Thai AirAsia faces intense competition from full-service and budget carriers, impacting its growth rate.
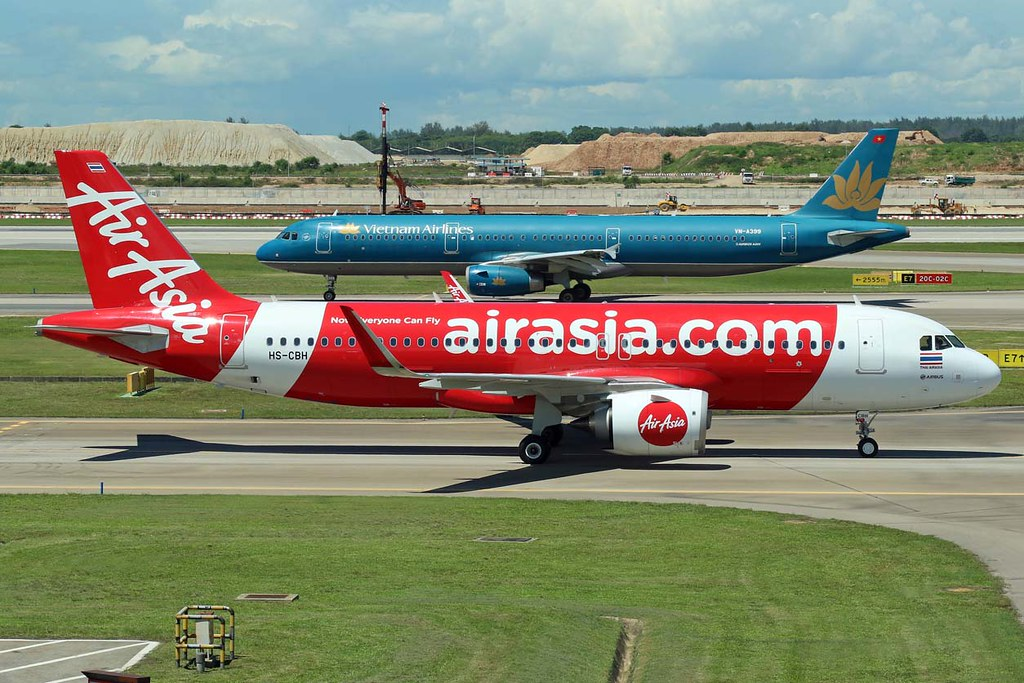 Photo: HS-CBH Airbus A320-251N Thai AirAsia cn 8052 | dreamcatcher-68 | Flickr
11. Bangkok (BKK) – Nakhon Si Thammarat (NST)
- Passenger Volume: 925,806
- Market Share: 31%
- Thai AirAsia Passengers: 287,000
- YoY Growth Rate: 6.1%
Strong regional demand drives this route’s growth, emphasizing Thai AirAsia’s role in connecting secondary cities.
12. Bangkok (BKK) – Nakhon Phanom (KOP)
- Passenger Volume: 268,000
- Market Share: 100%
- Thai AirAsia Passengers: 268,000
- YoY Growth Rate: 9.4%
Holding a monopoly on this route, Thai AirAsia continues to dominate regional air travel with significant annual growth.
13. Bangkok (BKK) – Roi Et (ROI)
- Passenger Volume: 267,000
- Market Share: 100%
- Thai AirAsia Passengers: 267,000
- YoY Growth Rate: 0.0%
With no competition, Thai AirAsia’s passenger count remains stable, though growth has stalled.
14. Bangkok (BKK) – Ubon Ratchathani (UBP)
- Passenger Volume: 1,140,909
- Market Share: 22%
- Thai AirAsia Passengers: 251,000
- YoY Growth Rate: 1.9%
This route plays a vital role in linking Bangkok with northeast Thailand’s economic activities.
15. Bangkok (BKK) – Phitsanulok (PHS)
- Passenger Volume: 425,424
- Market Share: 59%
- Thai AirAsia Passengers: 251,000
- YoY Growth Rate: 11.3%
One of the fastest-growing domestic routes, reflecting increasing demand for central Thailand connections.
16. Chiang Mai (CNX) – Phuket (HKT)
- Passenger Volume: 504,082
- Market Share: 49%
- Thai AirAsia Passengers: 247,000
- YoY Growth Rate: 0.2%
Despite seasonal fluctuations, this key domestic route maintains a steady market share.
17. Bangkok (BKK) – Da Nang (DAD)
- Passenger Volume: 592,500
- Market Share: 40%
- Thai AirAsia Passengers: 237,000
- YoY Growth Rate: 2.6%
Growth remains stable, highlighting Da Nang as an emerging Southeast Asian destination.
18. Bangkok (BKK) – Nan (NNT)
- Passenger Volume: 370,313
- Market Share: 64%
- Thai AirAsia Passengers: 237,000
- YoY Growth Rate: -2.4%
A minor decline indicates fluctuating demand for this regional route.
19. Bangkok (BKK) – Ho Chi Minh City (SGN)
- Passenger Volume: 1,072,727
- Market Share: 22%
- Thai AirAsia Passengers: 236,000
- YoY Growth Rate: 0.4%
Competitive international market keeps growth rates modest for this Thailand-Vietnam connection.
20. Bangkok (BKK) – Macau (MFM)
- Passenger Volume: 418,868
- Market Share: 53%
- Thai AirAsia Passengers: 222,000
- YoY Growth Rate: -4.2%
Declining demand suggests a shift in travel preferences or increased competition on this international route.
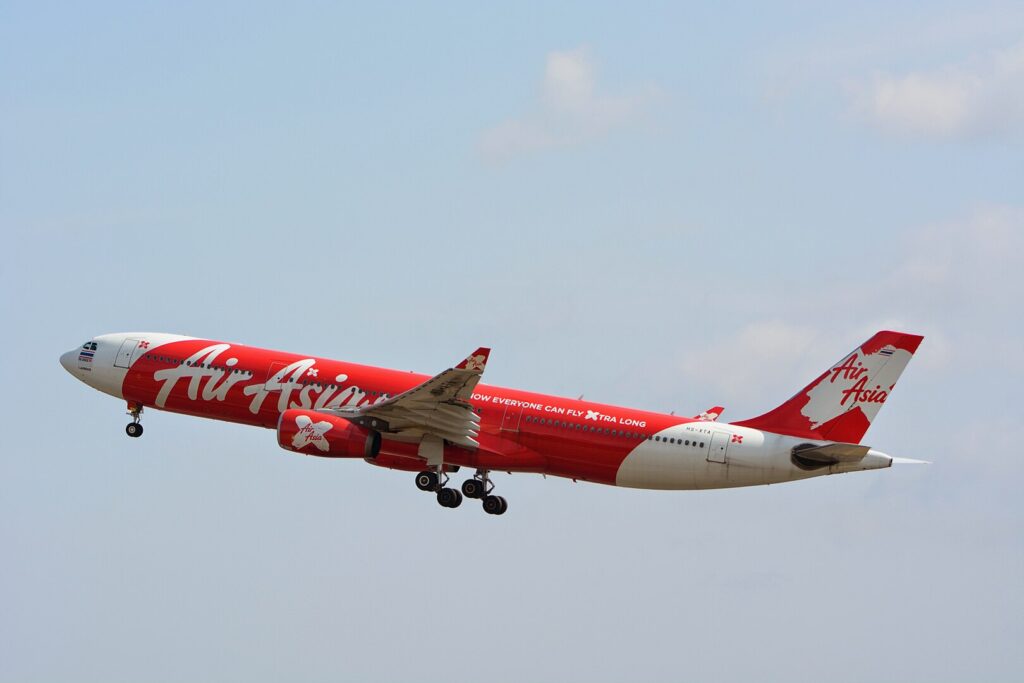 Photo: By Masakatsu Ukon – Thai AirAsia X, Airbus A330-300 HS-XTA NRT, CC BY-SA 2.0, https://commons.wikimedia.org/w/index.php?curid=42014140
Shifting Market Share
The airline industry is highly competitive, and market share fluctuations are inevitable.
Thai AirAsia’s (FD) latest data on its top 20 busiest routes reveals both positive and negative trends, influenced by factors such as evolving travel demand, operational adjustments, and competitive pressures.
Strong Performing Routes
Several routes have maintained or expanded their market presence. Notably:
- Bangkok-Chiang Mai remains the highest-volume route, with 1.65 million passengers and a 5.2% YoY increase.
- Bangkok-Surat Thani has seen a 6.2% growth in the past year, indicating rising demand for travel to the southern region.
- Bangkok-Nakhon Phanom recorded the highest growth rate at 9.4%, possibly due to increased connectivity and tourism interest.
- Bangkok-Phitsanulok had an impressive 11.3% increase, the highest among domestic routes.
Routes Facing Decline
Some routes have witnessed a drop in passenger volume, highlighting challenges in demand or strategic shifts:
- Bangkok-Singapore declined by -5.3%, suggesting increased competition or reduced demand.
- Chiang Mai-Phuket dropped by -6.5%, possibly due to seasonal fluctuations or alternative travel options.
- Bangkok-Nan and Bangkok-Macau saw declines of -2.4% and -4.2%, respectively, indicating weaker demand.
Market share shifts reflect airline priorities. Thai AirAsia holds significant shares on some domestic routes, such as Bangkok-Phitsanulok (59%) and Bangkok-Nan (64%), showcasing dominance in these segments.
However, lower shares on international routes, such as Bangkok-Hong Kong (11%) and Bangkok-Singapore (13%), suggest challenges in competing with full-service carriers.
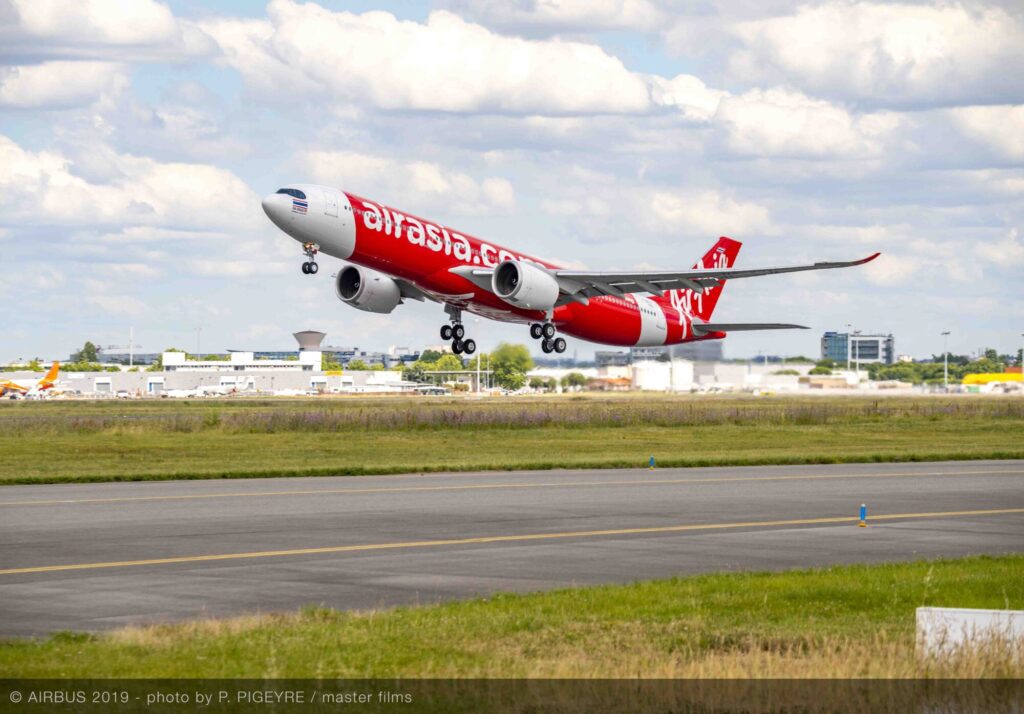
 Photo: Melvin Loi | Flickr
Future Trends
While passenger volume is a key indicator, airlines often focus on revenue optimization. Thai AirAsia may adjust capacity on underperforming routes or introduce promotional fares to regain market share.
Growth in routes like Bangkok-Nakhon Phanom (9.4%) suggests that regional expansion remains a priority.
Meanwhile, the decline in high-traffic international routes could push the airline to rethink pricing strategies and partnerships.
Bottom Line
Thai AirAsia busiest routes performance reflects the dynamic nature of the aviation industry. While some routes continue to thrive, others face setbacks, influenced by competition, operational strategies, and traveler preferences.
The airline’s ability to adapt will determine its long-term market position.
Stay tuned with us. Further, follow us on social media for the latest updates.
Join us on Telegram Group for the Latest Aviation Updates. Subsequently, follow us on Google News
AirAsia to Launch New Flights to Europe and US by 2030, Expansion Plans and More
The post Top 20 Busiest Routes of Thai AirAsia, No. 5 Will Surprise You! appeared first on Aviation A2Z.