
ABU DHABI- Etihad Airways (EY), the flag carrier of the United Arab Emirates (UAE), has demonstrated remarkable growth across its network with passenger volume increasing by over 30% in the past year.
The airline’s operational performance remains strong, particularly in its widebody fleet which ranks as the most profitable among major Middle Eastern carriers according to recent Q3 2024 data from AvBench.
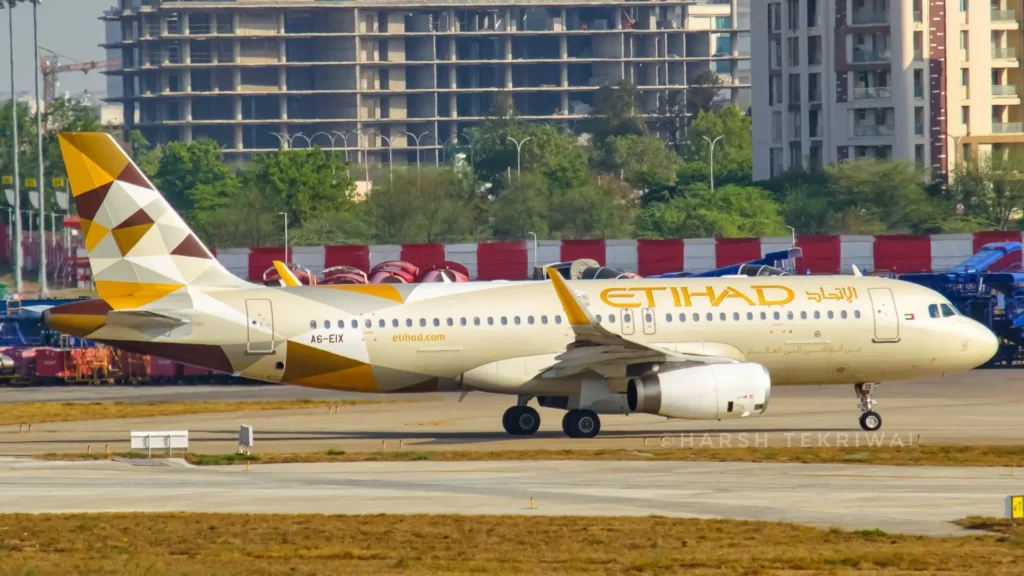 Photo: avgeekwithlens/ Harsh Tekriwal
Etihad Short-Haul Routes Performance
Etihad’s short-haul network (routes under 1,500nm) currently transports over 6 million passengers annually, representing a 32% increase compared to the previous year.
While these top routes constitute only 12% of Etihad total Available Seat Kilometers (ASK), they generate approximately $500 million in annual ticket revenue.
The India-UAE corridor remains Etihad’s dominant short-haul market, accounting for 53% of short-haul ASK deployment.
Other key markets include UAE-Saudi Arabia (13%), UAE-Pakistan (11%), UAE-Egypt (9%), and UAE-Jordan (3%).
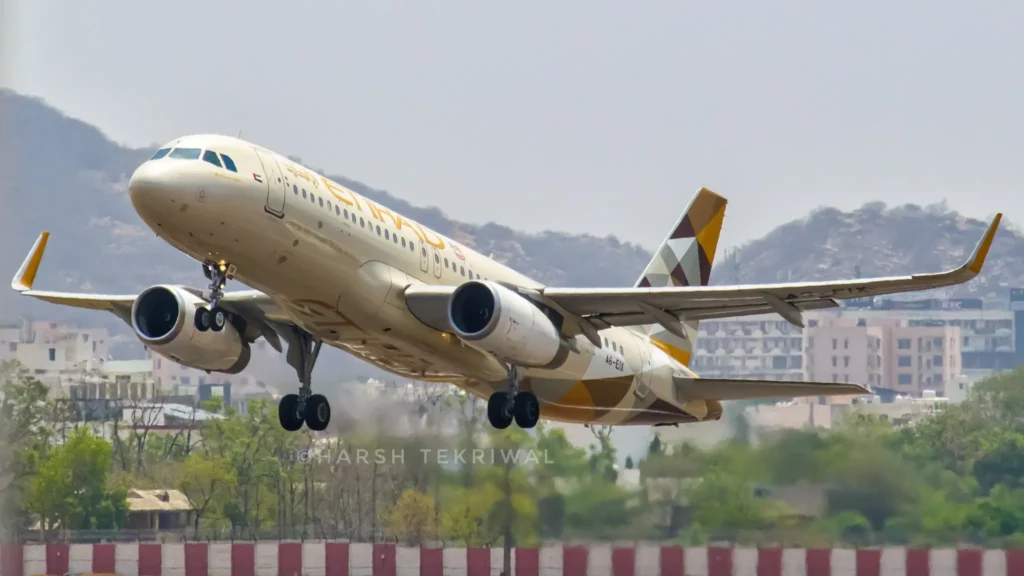 Photo: avgeekwithlens/ Harsh Tekriwal
Etihad Busiest Short-Haul Routes
Analysis of Etihad’s short-haul performance reveals the Abu Dhabi (AUH)–Delhi (DEL) route as the carrier’s strongest performer with a Market Outlook & eXpansion Index (MOXI) score of 7.9.
This route has seen remarkable growth with segment traffic increasing by 194,000 passengers, while maintaining an 85% market share.
| Abu Dhabi – Delhi | 7.9 ↑ | 99k (+39k) | 637k (+194k) | 85% (+16%) | 85% (+13%) | 0% |
| Abu Dhabi – Mumbai | 7.4 ↑ | 119k (+48k) | 562k (+171k) | 58% (+14%) | 60% (+11%) | -2% |
| Abu Dhabi – Cairo | 6.8 ↑ | 165k (+81k) | 372k (+139k) | 49% (+5%) | 46% (+5%) | +3% |
| Abu Dhabi – Jeddah | 6.8 ↑ | 74k (+17k) | 459k (+149k) | 83% (+5%) | 81% (+6%) | +2% |
| Abu Dhabi – Karachi | 6.8 ↑ | 48k (+10k) | 218k (+58k) | 100% (+0%) | 100% (+0%) | 0% |
| Abu Dhabi – Muscat | 6.5 ↑ | 145k (+92k) | 300k (+151k) | 44% (-2%) | 47% (-5%) | -3% |
| Abu Dhabi – Doha | 6.4 ↑ | 60k (+27k) | 288k (+112k) | 45% (+6%) | 43% (+10%) | +2% |
| Abu Dhabi – Riyadh | 6.0 ↑ | 79k (+13k) | 358k (+80k) | 83% (+2%) | 79% (+2%) | +4% |
| Abu Dhabi – Jaipur | 6.0 ↑ | 5k (+5k) | 15k (+15k) | 100% | 100% | 0% |
| Abu Dhabi – Antalya | 5.9 ↑ | 4k (+4k) | 10k (+10k) | 48% (+48%) | 49% (+49%) | -1% |
| Abu Dhabi – Dammam | 5.9 ↑ | 95k (+30k) | 305k (+47k) | 68% (-1%) | 69% (-2%) | -1% |
| Abu Dhabi – Amman | 5.8 ↑ | 62k (+19k) | 106k (+18k) | 38% (-1%) | 40% (+1%) | -2% |
| Abu Dhabi – Kuwait | 5.7 ↑ | 116k (+31k) | 278k (+94k) | 48% (+1%) | 51% (-1%) | -3% |
| Abu Dhabi – Bahrain | 5.4 ↑ | 49k (+0k) | 178k (+26k) | 40% (+7%) | 42% (+3%) | -2% |
| Abu Dhabi – Calicut-Koz. | 5.3 ↑ | 27k (+26k) | 80k (+80k) | 19% (+19%) | 18% (+18%) | +1% |
| Abu Dhabi – Tel Aviv-Yafo | 4.8 ↓ | 11k (-20k) | 86k (-44k) | 65% (+16%) | 55% (+5%) | +10% |
| Abu Dhabi – Bengaluru | 4.7 ↓ | 42k (+5k) | 277k (+36k) | 90% (-10%) | 92% (-8%) | -2% |
| Abu Dhabi – Islamabad | 4.2 ↓ | 23k (-1k) | 237k (+26k) | 59% (0%) | 55% (+0%) | +4% |
| Abu Dhabi – Ahmedabad | 4.1 ↓ | 32k (+13k) | 226k (+32k) | 58% (-13%) | 58% (-12%) | 0% |
| Abu Dhabi – Lahore | 3.8 ↓ | 16k (-6k) | 182k (+1k) | 66% (-3%) | 62% (-2%) | +4% |
| Abu Dhabi – Hyderabad | 3.7 ↓ | 34k (+1k) | 260k (+19k) | 70% (-7%) | 74% (-7%) | -4% |
| Abu Dhabi – Beirut | 2.9 ↓ | 20k (-7k) | 64k (-10k) | 39% (-7%) | 38% (-6%) | +1% |
Other top-performing short-haul routes include Abu Dhabi-Mumbai (MOXI: 7.4), Abu Dhabi-Cairo (MOXI: 6.8), Abu Dhabi-Jeddah (MOXI: 6.8), and Abu Dhabi-Karachi (MOXI: 6.8).
The airline has achieved 100% market share on its Abu Dhabi-Karachi route, demonstrating its dominance in certain markets.
Conversely, challenging routes include Abu Dhabi-Beirut with a low MOXI score of 2.9, reflecting a decline of 7,000 point-to-point passengers and 10,000 segment passengers.
The Abu Dhabi-Hyderabad (MOXI: 3.7) and Abu Dhabi-Lahore (MOXI: 3.8) routes also show signs of underperformance.
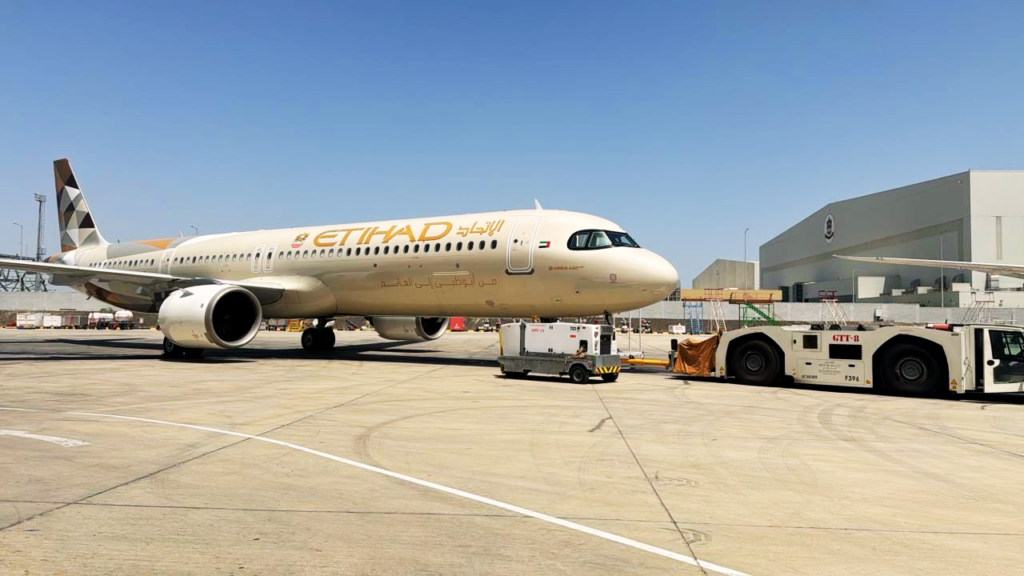 Photo: Arish Sayed | LinkedIn
Fleet Composition and Opportunities
Etihad top short-haul routes are served by three aircraft types: the A320 (14 aircraft, average age 12.9 years), A321 (9 aircraft, average age 9.5 years), and A321neo (6 aircraft with 20 more on order, average age 5.3 years).
Despite facing growing competition from Air Arabia (G9), IndiGo (6E), and Wizz Air Abu Dhabi (5W), Etihad’s aging A320s continue to deliver respectable performance with a Commercial & Operational Fit Index (COFI) score of 5.5.
The A321s perform better with a COFI score of 7.7, partly due to their deployment on longer routes which helps reduce operating costs.
The A321neo fleet, though currently operating on relatively short routes, shows significant potential for Etihad with a COFI score of 9.9.
These aircraft will be essential for maintaining market share on short-haul routes while preserving profitability, following a strategy similar to flydubai’s successful deployment of Boeing MAX aircraft.
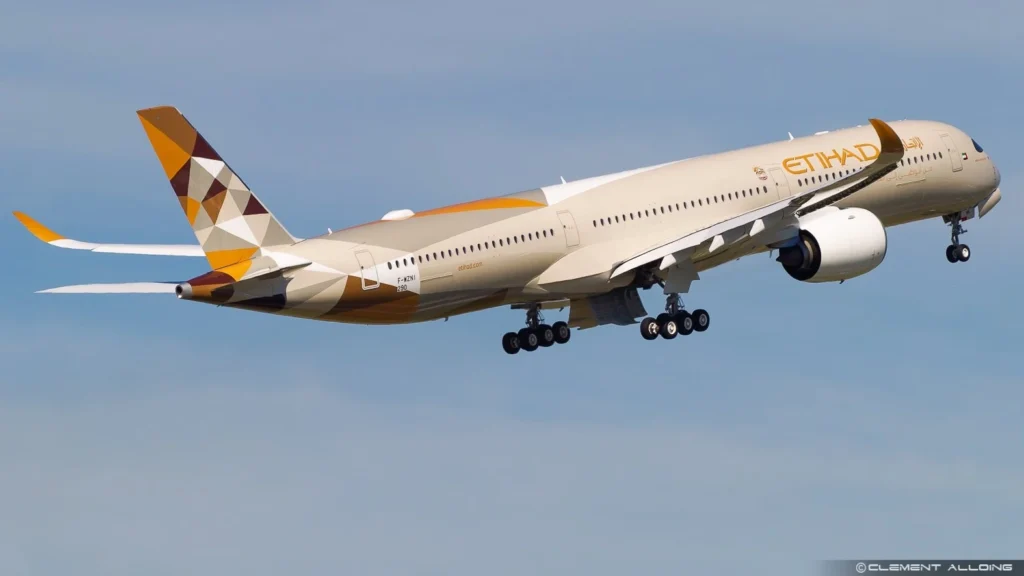 Photo: Clément Alloing
Medium/Long-Haul Network Performance
Etihad’s medium and long-haul network (routes beyond 1,500nm) serves more than 11.5 million passengers annually, representing a robust 35% growth over the previous year.
Etihad top routes generate approximately $3 billion in ticket revenue and account for 88% of total ASK deployment.
The Middle East-Europe corridor dominates Etihad’s long-haul operations at 37% of ASK, followed closely by Middle East-Asia (34%), Middle East-North America (19%), Middle East-Oceania (7%), and Middle East-Africa (2%).
In most of these markets, Etihad ranks as the third or fourth largest carrier, competing primarily with Emirates (EK), Qatar Airways (QR), and Turkish Airlines (TK).
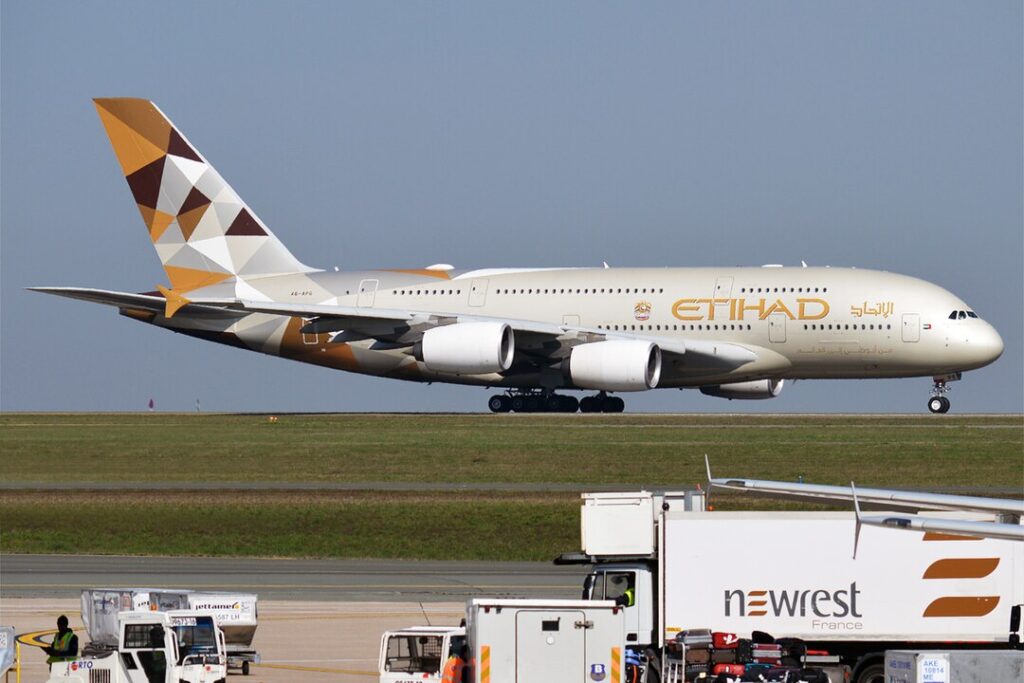 Photo: By Anna Zvereva from Tallinn, Estonia – Etihad Airways, A6-APG, Airbus A380-861, CC BY-SA 2.0, https://commons.wikimedia.org/w/index.php?curid=78120484
Etihad Busiest 30 medium/Long Haul Routes
Abu Dhabi (AUH)-Phuket (HKT) emerges as Etihad’s strongest long-haul performer with a MOXI score of 7.2, having gained 214,000 segment passengers.
| Abu Dhabi – Phuket | 7.2 ↑ | 13k (+6k) | 397k (+214k) | 100% (+0%) | 100% (+0%) | 0% |
| Abu Dhabi – Bangkok | 7.1 ↑ | 34k (+10k) | 499k (+197k) | 100% (+0%) | 100% (+0%) | 0% |
| Abu Dhabi – Jakarta | 6.9 ↑ | 31k (+12k) | 345k (+110k) | 100% (0%) | 100% (0%) | 0% |
| Abu Dhabi – Kochi | 6.8 ↑ | 62k (+32k) | 354k (+179k) | 44% (+13%) | 41% (+10%) | +3% |
| Abu Dhabi – Frankfurt | 6.7 ↑ | 40k (+5k) | 278k (+55k) | 100% (+1%) | 100% (+4%) | 0% |
| Abu Dhabi – London | 6.5 ↑ | 144k (+50k) | 950k (+244k) | 95% (-5%) | 95% (-5%) | 0% |
| Abu Dhabi – Kuala Lumpur | 6.5 ↑ | 20k (+8k) | 312k (+101k) | 100% (+0%) | 100% (+0%) | 0% |
| Abu Dhabi – Toronto | 6.4 ↑ | 13k (+3k) | 233k (+51k) | 100% (+0%) | 100% (+0%) | 0% |
| Abu Dhabi – New York | 6.3 ↑ | 18k (+6k) | 354k (+68k) | 100% (+0%) | 100% (0%) | 0% |
| Abu Dhabi – Munich | 6.2 ↑ | 28k (+5k) | 227k (+63k) | 100% (+0%) | 100% (+0%) | 0% |
| Abu Dhabi – Dublin | 6.1 ↑ | 10k (+2k) | 203k (+36k) | 100% (0%) | 100% (0%) | 0% |
| Abu Dhabi – Parma | 6.1 ↑ | 27k (+12k) | 239k (+57k) | 100% (+0%) | 100% (+0%) | 0% |
| Abu Dhabi – Madrid | 6.0 ↑ | 13k (0k) | 230k (+60k) | 100% (+0%) | 100% (+0%) | 0% |
| Abu Dhabi – Rome | 6.0 ↑ | 16k (+7k) | 308k (+110k) | 66% (-4%) | 70% (-5%) | -4% |
| Abu Dhabi – Brussels | 5.9 ↑ | 8k (+2k) | 163k (+41k) | 100% (0%) | 100% (0%) | 0% |
| Abu Dhabi – Melbourne | 5.8 ↑ | 27k (+9k) | 192k (-26k) | 100% (+0%) | 100% (+1%) | 0% |
| Abu Dhabi – Manila | 5.7 ↑ | 75k (+12k) | 463k (+71k) | 100% (+0%) | 100% (0%) | 0% |
| Abu Dhabi – Chicago | 5.6 ↑ | 7k (+0k) | 225k (+26k) | 100% (+0%) | 100% (0%) | 0% |
| Abu Dhabi – Osaka | 5.5 ↑ | 4k (+4k) | 92k (+92k) | 100% | 100% | 0% |
| Abu Dhabi – Washington | 5.5 ↑ | 13k (+1k) | 159k (+25k) | 100% (+0%) | 100% (+0%) | 0% |
| Abu Dhabi – Barcelona | 5.5 ↑ | 12k (+2k) | 217k (+50k) | 100% (+0%) | 100% (0%) | 0% |
| Abu Dhabi – Chennai | 5.4 ↑ | 43k (+12k) | 291k (+89k) | 55% (+1%) | 56% (-1%) | -1% |
| Abu Dhabi – Tokyo | 5.2 ↓ | 17k (+3k) | 178k (+15k) | 100% (0%) | 100% (0%) | 0% |
| Abu Dhabi – Singapore | 5.2 ↓ | 19k (+4k) | 183k (+13k) | 100% (+0%) | 100% (+0%) | 0% |
| Abu Dhabi – Amsterdam | 5.1 ↓ | 17k (+3k) | 201k (+15k) | 100% (+0%) | 100% (+0%) | 0% |
| Abu Dhabi – Manchester | 5.0 ↓ | 26k (+5k) | 202k (+7k) | 100% (+0%) | 100% (+0%) | 0% |
| Abu Dhabi – Sydney | 4.9 ↓ | 18k (+5k) | 194k (-16k) | 100% (+0%) | 100% (0%) | 0% |
| Abu Dhabi – Seoul | 4.9 ↓ | 28k (-4k) | 205k (-10k) | 100% (+0%) | 100% (0%) | 0% |
| Abu Dhabi – Zurich | 4.8 ↓ | 11k (-1k) | 174k (+25k) | 100% (+0%) | 100% (0%) | 0% |
| Abu Dhabi – Paris | 4.2 ↓ | 22k (0k) | 210k (+24k) | 56% (-44%) | 61% (-39%) | -5% |
Other top routes include Abu Dhabi (AUH)-Bangkok (BKK) (MOXI: 7.1), Abu Dhabi-Jakarta (MOXI: 6.9), Abu Dhabi-London (MOXI: 6.5), and Abu Dhabi-Kuala Lumpur (MOXI: 6.5).
The data reveals that Etihad maintains 100% market share on most of its long-haul routes, with exceptions including Abu Dhabi-Paris (56% share, down 44%) and Abu Dhabi-Rome (66% share, down 4%).
Abu Dhabi-Paris stands out as underperforming with a MOXI score of 4.2, showing stagnant point-to-point traffic despite segment traffic growth.
Abu Dhabi-London represents Etihad’s busiest long-haul route by ASK, carrying 950,000 segment passengers (up 244,000) and maintaining a dominant 95% market share.
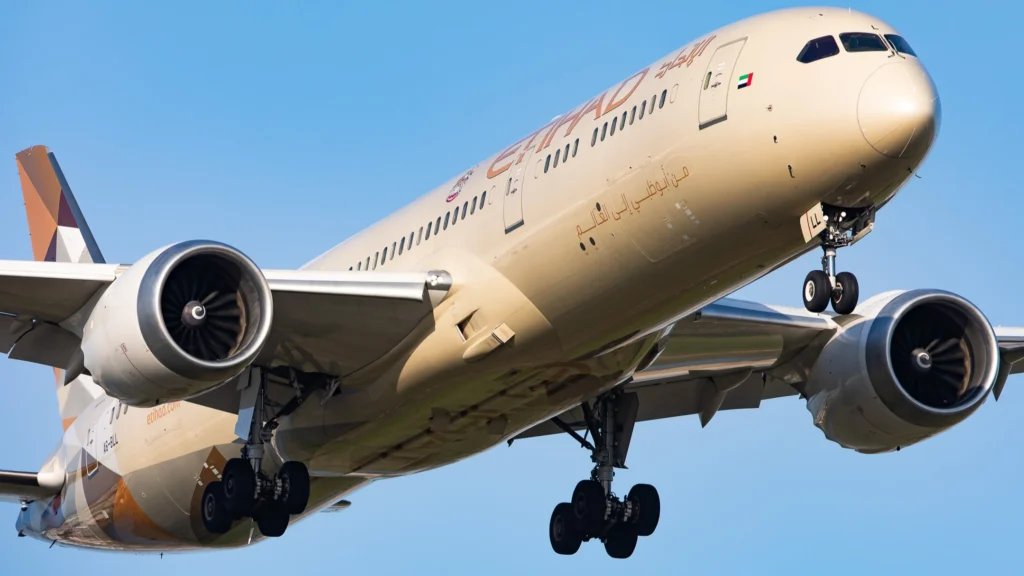 Photo: Clément Alloing
Fleet Composition and Opportunities
Etihad’s long-haul operations are served by five aircraft types: Boeing 787-9 (33 aircraft with 8 on order), Boeing 787-10 (10 aircraft with 20 on order), Airbus A350-1000 (5 aircraft with 15 on order), Airbus A380-800 (10 aircraft), and Boeing 777-300ER (9 aircraft).
The A380 fleet, which many industry observers thought would never return after the COVID crisis, now delivers the strongest performance with a COFI score of 8.6.
Other widebodies also perform well, with the 787-10 and A350-1000 both scoring 6.7, while the 787-9 earns a 6.0 and the aging 777-300ER a 5.8.
A key challenge identified for Etihad’s widebody fleet is its occasional deployment on routes that are too short (particularly to India), where it competes with narrowbodies offering better economics.
The pending delivery of 20 A321neos may address this inefficiency. Additionally, there remains potential for Etihad to improve aircraft utilization compared to regional competitors.
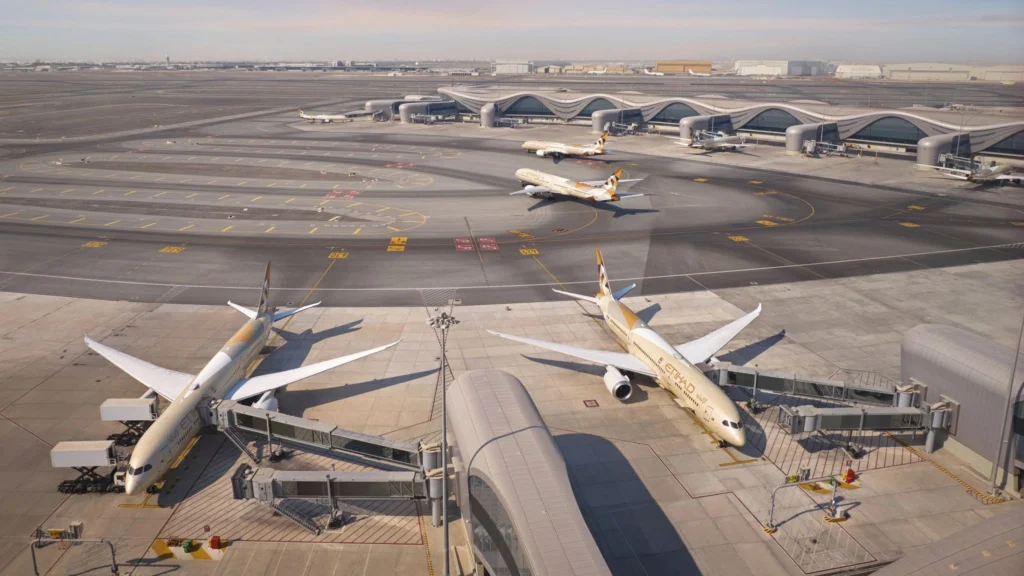 Photo: Arik De, Etihad
Methodology & Data Sources
The report utilizes two primary analytical frameworks: the Market Outlook & eXpansion Index (MOXI) and the Commercial & Operational Fit Index (COFI).
MOXI evaluates growth and competitive dynamics on specific routes, incorporating factors such as passenger volume evolution and market share.
For current routes, it examines traffic gains and market share trends; for future opportunities, it considers short-term capturable point-to-point volume and long-term connecting passenger potential.
COFI reflects the overall commercial and operational performance of a sub-fleet, considering factors including passenger market share performance, revenue market share performance, network aggressiveness, yield performance, cost/seat performance, aircraft utilization, and network maturity.
Data sources include Milanamos (traffic, revenue, and schedule data) and ch-aviation (fleet data), encompassing 1.5 billion origin & destination records, 2.4 billion flight segment records, and extensive schedule data from multiple global aviation sources.
Stay tuned with us. Further, follow us on social media for the latest updates.
Join us on Telegram Group for the Latest Aviation Updates. Subsequently, follow us on Google News
Etihad International Flight Schedule Changes for Summer 2025
The post Etihad Airways Top 30 Busiest Domestic and International Routes appeared first on Aviation A2Z.


![Sypią się mandaty dla rowerzystów na Floriańskiej. Wielu wciąż łamie zakaz [ZDJĘCIA]](https://cowkrakowie.pl/wp-content/uploads/2026/07/Florianska1.jpg)
