Where The World’s Ocean Plastic Waste Comes From
In the past decade, plastic pollution has become one of the most visible environmental issues worldwide. Every year, millions of tonnes of plastic enter the ocean, affecting marine life, coastal communities, and ecosystems.
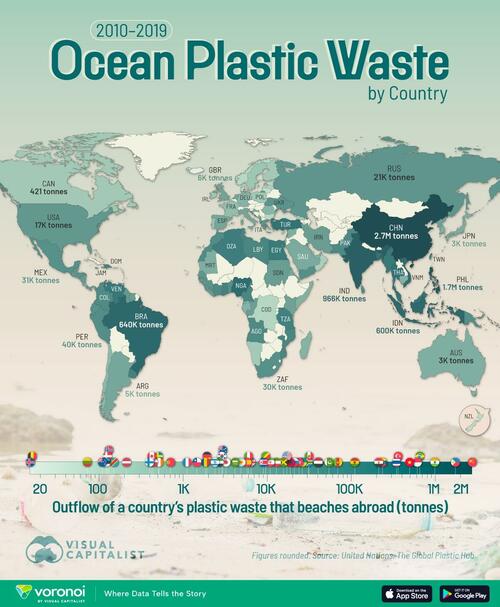
This visualization, via Visual Capitalist’s Bruno Venditti, ranks the countries responsible for the highest cumulative leakage of mismanaged plastic waste that escaped and washed up on other countries’ beaches from 2010 to 2019.
The data for this visualization comes from the Global Plastic Hub.
Asia Leads in Ocean Plastic Leakage
China is the largest contributor, responsible for over 2.6 million tonnes of plastic waste that ended up on foreign beaches.
It’s followed by the Philippines (1.7 million tonnes), and India (966,000 tonnes).
Rapid economic growth, urbanization, and inadequate waste management systems contribute to these high figures.
Seven of the top 10 countries on the list are in Asia, underlining the region’s central role in the global ocean plastic crisis.
| 1 | China | 2,683,631 |
| 2 | Philippines | 1,695,260 |
| 3 | India | 966,447 |
| 4 | Brazil | 639,665 |
| 5 | Indonesia | 599,020 |
| 6 | Nigeria | 496,841 |
| 7 | Viet Nam | 484,457 |
| 8 | Turkey | 354,441 |
| 9 | Thailand | 338,685 |
| 10 | Malaysia | 332,756 |
| 11 | Bangladesh | 315,755 |
| 12 | Venezuela | 231,132 |
| 13 | Bird Island | 231,132 |
| 14 | Myanmar | 209,495 |
| 15 | Egypt | 208,321 |
| 16 | Algeria | 157,952 |
| 17 | Tanzania | 114,737 |
| 18 | Ghana | 107,907 |
| 19 | Taiwan, Province of China | 97,418 |
| 20 | Uruguay | 94,544 |
| 21 | Tunisia | 89,176 |
| 22 | Haiti | 84,238 |
| 23 | Dominican Republic | 83,121 |
| 24 | Libya | 73,477 |
| 25 | Mozambique | 72,578 |
| 26 | Cameroon | 67,709 |
| 27 | Côte d’Ivoire | 57,394 |
| 28 | Pakistan | 53,641 |
| 29 | Angola | 52,877 |
| 30 | Colombia | 47,506 |
| 31 | Morocco | 44,087 |
| 32 | Sri Lanka | 41,648 |
| 33 | Peru | 39,863 |
| 34 | Papua New Guinea | 36,165 |
| 35 | Yemen | 35,625 |
| 36 | Trinidad and Tobago | 35,244 |
| 37 | Benin | 32,298 |
| 38 | Togo | 31,773 |
| 39 | Mexico | 31,004 |
| 40 | South Africa | 30,352 |
| 41 | Ecuador | 29,678 |
| 42 | Solomon Islands | 27,939 |
| 43 | Honduras | 26,859 |
| 44 | Greece | 25,983 |
| 45 | Ukraine | 25,859 |
| 46 | Guinea | 25,167 |
| 47 | Comoros | 24,691 |
| 48 | Sierra Leone | 23,826 |
| 49 | Hong Kong, China | 23,471 |
| 50 | Russian Federation | 20,770 |
| 51 | Senegal | 19,569 |
| 52 | Lebanon | 19,420 |
| 53 | Guatemala | 19,015 |
| 54 | Albania | 18,501 |
| 55 | U.S. | 16,910 |
| 56 | Panama | 16,346 |
| 57 | Jamaica | 16,260 |
| 58 | Belize | 15,383 |
| 59 | Guyana | 15,235 |
| 60 | Nicaragua | 15,199 |
| 61 | Liberia | 14,220 |
| 62 | Kuwait | 12,740 |
| 63 | Gambia | 12,178 |
| 64 | Suriname | 11,589 |
| 65 | Sudan | 11,308 |
| 66 | Guinea-Bissau | 10,819 |
| 67 | Iran | 10,750 |
| 68 | Congo | 9,476 |
| 69 | Democratic People’s Republic of Korea | 8,873 |
| 70 | Kenya | 7,941 |
| 71 | El Salvador | 7,504 |
| 72 | Netherlands | 6,488 |
| 73 | UK | 6,242 |
| 74 | Timor-Leste | 6,238 |
| 75 | Italy | 5,930 |
| 76 | Spain | 5,708 |
| 77 | Canary Islands (Sp.) | 5,708 |
| 78 | Eritrea | 5,677 |
| 79 | Equatorial Guinea | 5,328 |
| 80 | Argentina | 4,847 |
| 81 | Costa Rica | 4,384 |
| 82 | Saudi Arabia | 4,099 |
| 83 | Croatia | 3,964 |
| 84 | Djibouti | 3,401 |
| 85 | Japan | 3,208 |
| 86 | Syrian Arab Republic | 3,019 |
| 87 | Australia | 2,920 |
| 88 | Ashmore & Cartier Is. | 2,920 |
| 89 | Republic of Korea | 2,865 |
| 90 | Mauritania | 2,845 |
| 91 | United Arab Emirates | 2,659 |
| 92 | Somalia | 2,371 |
| 93 | Israel | 2,368 |
| 94 | Fiji | 2,340 |
| 95 | Cambodia | 2,212 |
| 96 | Gabon | 2,199 |
| 97 | Madagascar | 2,132 |
| 98 | Germany | 1,899 |
| 99 | Romania | 1,825 |
| 100 | Montenegro | 1,804 |
| 101 | Saint Lucia | 1,591 |
| 102 | Chile | 1,447 |
| 103 | Sao Tome and Principe | 1,255 |
| 104 | France | 1,105 |
| 105 | Vanuatu | 997 |
| 106 | Cape Verde | 975 |
| 107 | Qatar | 868 |
| 108 | Samoa | 809 |
| 109 | Brunei Darussalam | 797 |
| 110 | Portugal | 702 |
| 111 | Azores Islands (Port.) | 702 |
| 112 | Madeira Islands (Port.) | 702 |
| 113 | Grenada | 553 |
| 114 | Sweden | 514 |
| 115 | Ireland | 508 |
| 116 | Saint Vincent and the Grenadines | 466 |
| 117 | Poland | 439 |
| 118 | Georgia | 424 |
| 119 | Canada | 421 |
| 120 | Dominica | 408 |
| 121 | Finland | 397 |
| 122 | Namibia | 387 |
| 123 | Barbados | 302 |
| 124 | Puerto Rico (USA) | 287 |
| 125 | Oman | 258 |
| 126 | Tonga | 246 |
| 127 | Latvia | 211 |
| 128 | Bahrain | 204 |
| 129 | Bahamas | 179 |
| 130 | Antigua and Barbuda | 172 |
| 131 | Micronesia | 167 |
| 132 | DRC | 149 |
| 133 | Norway | 130 |
Plastic Waste Doesn’t Stay Local
Plastic debris often travel thousands of kilometers across oceans, carried solely by currents, wind, tides, and time.
For example, the Great Pacific Garbage Patch—a massive swirling zone between California and Hawaii—accumulates plastic from as far as Asia, North America, and South America.
The patch spans around 1.6 million km², comparable to twice the size of Texas.
The annual economic costs due to marine plastic pollution are estimated to be between $6-19 billion. According to the OECD, preventing land-based plastic leakage into the ocean across 38 member countries and 10 major plastic waste emitters in Asia and Africa could cost more than $86 billion.
If you enjoyed today’s post, check out Ranked: The Most Expensive U.S. Wildfires, So Far on Voronoi, the new app from Visual Capitalist.
Tyler Durden
Tue, 09/09/2025 – 04:15


![Belgian Cheetahs for Ukraine. Deadlock broken [COMMENTARY]](https://cdn.defence24.pl/2026/04/28/1200xpx/lhXZO5zhPpO9iaCjoVlnBSZL9TevIJslKNZT5pPe.reia.jpg)