DENVER- Frontier Airlines’ (F9) top 20 busiest routes analysis reveals a mixed performance pattern, with notable market share dominance on several routes despite experiencing declining volumes in key markets.
The ultra-low-cost carrier maintains strong positions in Philadelphia-focused routes while showing vulnerability in some western U.S. corridors.
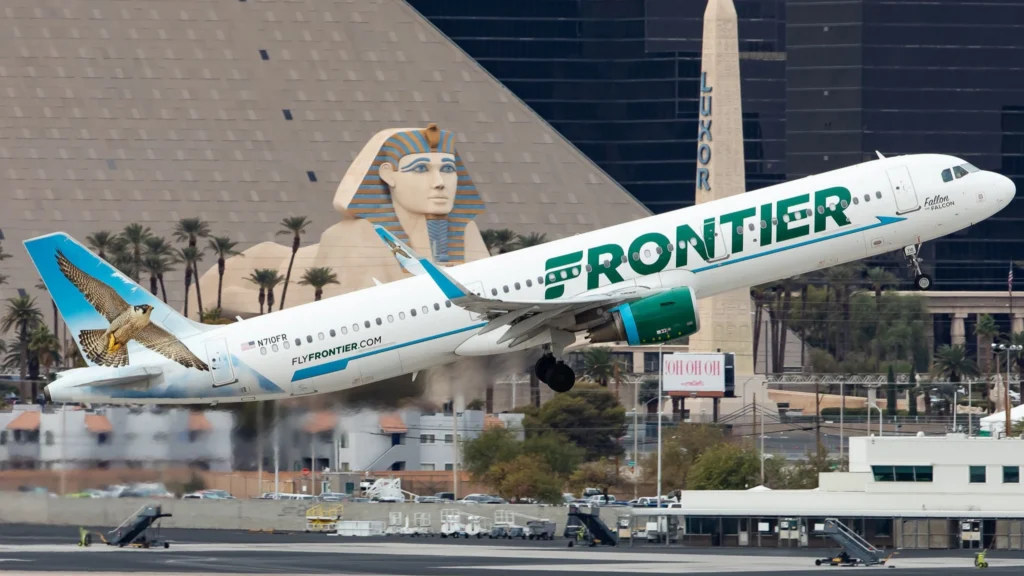
 Photo: Clément Alloing
20 Busiest Routes of Frontier
The airline’s route network data through Q3 2024 demonstrates particular strength in Cleveland-Tampa (66% market share) and Philadelphia-Tampa (49% market share) routes, though year-over-year performance varies significantly across its network.
Frontier Airlines (F9), headquartered in Denver, operates heavily in competitive markets, with significant growth on certain routes while showing a decline in others.
Its frontier top busiest route, Orlando-Philadelphia, boasts a 43% market share with 801,000 passengers. Despite a 3.4% gain over three years, the route witnessed a 2.9% decline in the last 12 months, signaling potential competitive or strategic adjustments.
Other key routes, such as Philadelphia-Tampa (447,000 passengers, 49% market share), experienced strong three-year growth (6.1%) but a moderate gain of 2.3% in the past year.
Similarly, Denver-Las Vegas holds a notable 30% market share with 415,000 passengers but faced a decline of -1.3% over three years, contrasting with a recent uptick of 2.1%.
The Las Vegas-Los Angeles route, although holding a smaller market share of 9%, shows stability with slight dips of -0.2% and +2.1% over three years and one year, respectively.
The below table shows the Top 20 busiest routes of Frontier (F9) by Passenger carried:
| 1 | Orlando-Philadelphia | 1,862,791 | 43% | 801,000 | -2.9% |
| 2 | Philadelphia-Tampa | 912,245 | 49% | 447,000 | 2.3% |
| 3 | Denver-Las Vegas | 1,383,333 | 30% | 415,000 | 2.1% |
| 4 | Las Vegas-Los Angeles | 4,211,111 | 9% | 379,000 | 2.1% |
| 5 | Orlando-San Juan | 1,600,000 | 23% | 368,000 | 0.5% |
| 6 | Denver-Dallas | 1,750,000 | 20% | 350,000 | 3.5% |
| 7 | Atlanta-Philadelphia | 1,116,129 | 31% | 346,000 | -0.8% |
| 8 | Miami-Philadelphia | 1,500,000 | 23% | 345,000 | -2.5% |
| 9 | Denver-Phoenix | 1,633,333 | 21% | 343,000 | 4.5% |
| 10 | Atlanta-Miami | 2,766,667 | 12% | 332,000 | 1.5% |
| 11 | Denver-Los Angeles | 2,750,000 | 12% | 330,000 | 2.7% |
| 12 | Cleveland-Orlando | 715,556 | 45% | 322,000 | 1.2% |
| 13 | Las Vegas-San Francisco | 2,080,000 | 15% | 312,000 | 2.5% |
| 14 | Atlanta-Orlando | 1,376,190 | 21% | 289,000 | 4.2% |
| 15 | Cincinnati-Orlando | 626,087 | 46% | 288,000 | 3.8% |
| 16 | Atlanta-Chicago | 1,731,250 | 16% | 277,000 | 3.8% |
| 17 | Cleveland-Tampa | 406,061 | 66% | 268,000 | -2.5% |
| 18 | Charlotte-Philadelphia | 628,571 | 42% | 264,000 | 9.6% |
| 19 | Las Vegas-Phoenix | 1,113,043 | 23% | 256,000 | 7.6% |
| 20 | Denver-Orlando | 1,016,000 | 25% | 254,000 | -3.8% |
1. Orlando International Airport (MCO) – Philadelphia International Airport (PHL)
- Passenger Volume: 1,862,791
- Market Share: 43%
- Frontier Passengers: 801,000
- YoY Growth Rate: -2.9%
This is top one of the busiest routes of Frontier, connecting Florida’s tourism hub with the northeastern metropolitan area.
Despite the significant -2.9% decline in year-over-year growth, it maintains a strong market presence with a 43% share, demonstrating its strategic importance in Frontier’s network.
2. Philadelphia International Airport (PHL) – Tampa International Airport (TPA)
- Passenger Volume: 912,245
- Market Share: 49%
- Frontier Passengers: 447,000
- YoY Growth Rate: 2.3%
Representing a vital Florida-Northeast connection, this route showcases Frontier’s dominant market position with nearly half the market share.
The positive growth rate indicates strong performance and successful competition against legacy carriers in this leisure-focused market.
3. Denver International Airport (DEN) – Las Vegas Harry Reid International Airport (LAS)
- Passenger Volume: 1,383,333
- Market Share: 30%
- Frontier Passengers: 415,000
- YoY Growth Rate: 2.1%
Connecting Frontier’s home base in Denver with Las Vegas, this route maintains healthy growth despite intense competition. The 30% market share demonstrates Frontier’s strong presence in Western markets, particularly in leisure-focused destinations.
4. Las Vegas Harry Reid International Airport (LAS) – Los Angeles International Airport (LAX)
- Passenger Volume: 4,211,111
- Market Share: 9%
- Frontier Passengers: 379,000
- YoY Growth Rate: 2.1%
Despite having the lowest market share among top routes, this high-volume corridor between major western cities shows steady growth. The route’s total passenger volume indicates significant market potential for further expansion.
5. Orlando International Airport (MCO) – Luis Muñoz Marín International Airport (SJU)
- Passenger Volume: 1,600,000
- Market Share: 23%
- Frontier Passengers: 368,000
- YoY Growth Rate: 0.5%
This Caribbean connection demonstrates Frontier’s expansion beyond mainland routes. While growth is modest, the steady market share suggests stable demand for this leisure route connecting Florida with Puerto Rico.
6. Denver International Airport (DEN) – Dallas/Fort Worth International Airport (DFW)
- Passenger Volume: 1,750,000
- Market Share: 20%
- Frontier Passengers: 350,000
- YoY Growth Rate: 3.5%
Showing robust growth, this route connects two major hub cities in the western United States. The positive growth rate indicates successful competition against legacy carriers in this business-heavy market.
7. Hartsfield-Jackson Atlanta International Airport (ATL) – Philadelphia International Airport (PHL)
- Passenger Volume: 1,116,129
- Market Share: 31%
- Frontier Passengers: 346,000
- YoY Growth Rate: -0.8%
Despite a slight decline in growth, this route maintains a significant market share connecting two major East Coast metropolitan areas. The high market share indicates strong competitive positioning against major carriers.
8. Miami International Airport (MIA) – Philadelphia International Airport (PHL)
- Passenger Volume: 1,500,000
- Market Share: 23%
- Frontier Passengers: 345,000
- YoY Growth Rate: -2.5%
Another crucial Florida-Northeast connection shows some challenges with negative growth. However, the maintained market share suggests continued importance in Frontier’s network strategy.
9. Denver International Airport (DEN) – Phoenix Sky Harbor International Airport (PHX)
- Passenger Volume: 1,633,333
- Market Share: 21%
- Frontier Passengers: 343,000
- YoY Growth Rate: 4.5%
This western route shows impressive growth, connecting two major mountain region airports. The positive trajectory suggests a successful market strategy and growing demand for this service.
10. Hartsfield-Jackson Atlanta International Airport (ATL) – Miami International Airport (MIA)
- Passenger Volume: 2,766,667
- Market Share: 12%
- Frontier Passengers: 332,000
- YoY Growth Rate: 1.5%
Connecting two major southeastern hubs, this route maintains steady growth despite lower market share. The high total passenger volume indicates significant market potential.
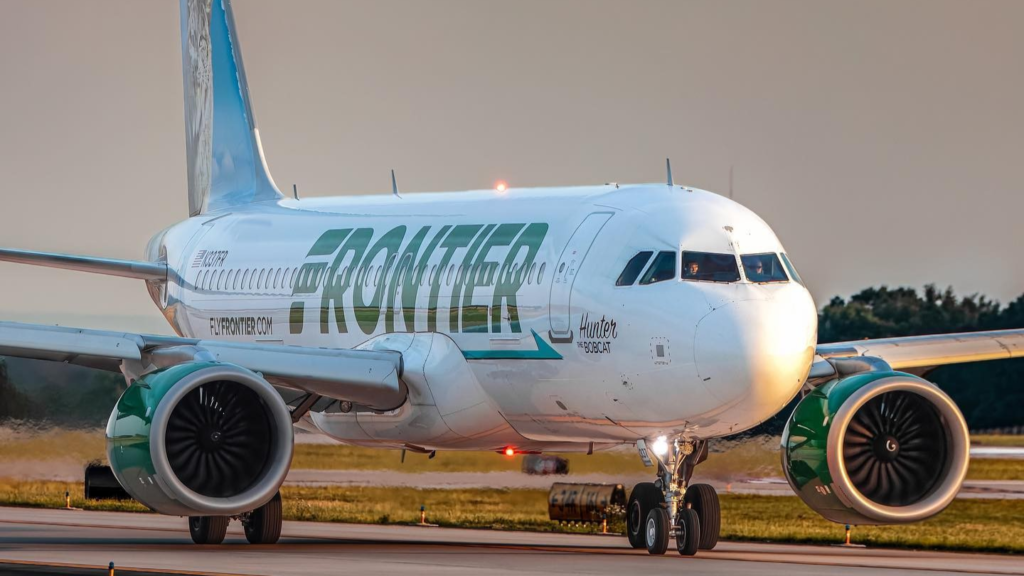
 Photo: Cado Photo
11. Denver International Airport (DEN) – Los Angeles International Airport (LAX)
- Passenger Volume: 2,750,000
- Market Share: 12%
- Frontier Passengers: 330,000
- YoY Growth Rate: 2.7%
This major west coast to mountain region connection shows healthy growth despite competitive pressure. The route demonstrates Frontier’s ability to maintain market position in high-traffic corridors.
12. Cleveland Hopkins International Airport (CLE) – Orlando International Airport (MCO)
- Passenger Volume: 715,556
- Market Share: 45%
- Frontier Passengers: 322,000
- YoY Growth Rate: 1.2%
This route shows Frontier’s strength in connecting mid-sized markets to leisure destinations. The high market share indicates the dominant position in this Midwest-Florida corridor.
13. Las Vegas Harry Reid International Airport (LAS) – San Francisco International Airport (SFO)
- Passenger Volume: 2,080,000
- Market Share: 15%
- Frontier Passengers: 312,000
- YoY Growth Rate: 2.5%
This western corridor shows steady growth despite a moderate market share. The route connects two major leisure and business destinations with consistent performance.
14. Hartsfield-Jackson Atlanta International Airport (ATL) – Orlando International Airport (MCO)
- Passenger Volume: 1,376,190
- Market Share: 21%
- Frontier Passengers: 289,000
- YoY Growth Rate: 4.2%
Strong growth characterizes this Southeast regional route. The positive performance indicates successful competition in connecting major southeastern transit hubs.
15. Cincinnati/Northern Kentucky International Airport (CVG) – Orlando International Airport (MCO)
- Passenger Volume: 626,087
- Market Share: 46%
- Frontier Passengers: 288,000
- YoY Growth Rate: 3.8%
This route demonstrates Frontier’s success in mid-sized markets, with impressive market share and growth. The performance indicates a strong demand for leisure travel from the Ohio Valley region.
16. Hartsfield-Jackson Atlanta International Airport (ATL) – Chicago O’Hare International Airport (ORD)
- Passenger Volume: 1,731,250
- Market Share: 16%
- Frontier Passengers: 277,000
- YoY Growth Rate: 3.8%
Connecting two major U.S. hubs, this route shows strong growth despite competitive pressure. The performance indicates successful penetration of business-heavy markets.
17. Cleveland Hopkins International Airport (CLE) – Tampa International Airport (TPA)
- Passenger Volume: 406,061
- Market Share: 66%
- Frontier Passengers: 268,000
- YoY Growth Rate: -2.5%
Despite the recent decline, this route maintains the highest market share in Frontier’s network. The dominant position demonstrates a successful focus on mid-sized market opportunities.
18. Charlotte Douglas International Airport (CLT) – Philadelphia International Airport (PHL)
- Passenger Volume: 628,571
- Market Share: 42%
- Frontier Passengers: 264,000
- YoY Growth Rate: 9.6%
Showing the strongest growth in the network, this East Coast connection demonstrates Frontier’s successful expansion strategy. The high market share indicates strong competitive positioning.
19. Las Vegas Harry Reid International Airport (LAS) – Phoenix Sky Harbor International Airport (PHX)
- Passenger Volume: 1,113,043
- Market Share: 23%
- Frontier Passengers: 256,000
- YoY Growth Rate: 7.6%
This Southwest corridor shows impressive growth and solid market share. The route’s performance indicates successful penetration of regional markets.
20. Denver International Airport (DEN) – Orlando International Airport (MCO)
- Passenger Volume: 1,016,000
- Market Share: 25%
- Frontier Passengers: 254,000
- YoY Growth Rate: -3.8%
Despite showing the steepest decline in the network, this transcontinental route maintains a significant market share. The performance suggests challenging conditions in long-haul leisure markets.
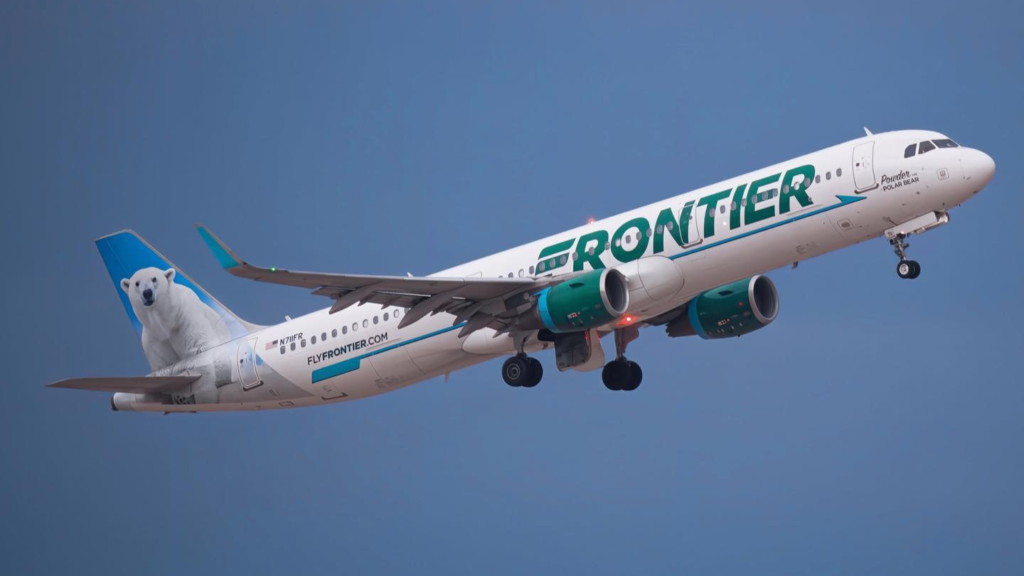
 Photo: Cado Photo
Analysis
Market Share Analysis
Frontier’s strongest market presence centers on routes connecting Philadelphia, maintaining market shares above 40% on multiple routes including Orlando (43%), Tampa (49%), and Charlotte (42%).
This concentration suggests a strategic focus on the northeastern United States, particularly leveraging Philadelphia as a key operational hub.
Routes Growth
Several routes have demonstrated consistent growth, underscoring Frontier’s strengths in specific markets:
- Cincinnati-Orlando (288,000 passengers, 46% market share): This route gained 5.3% over three years and 3.8% in the last year, reflecting steady passenger demand.
- Cleveland-Tampa (268,000 passengers, 66% market share): Despite leading the market, it showed a 2.5% decline over the last 12 months, likely due to competitive factors.
- Atlanta-Chicago (277,000 passengers, 16% market share): With growth rates of 5.5% (three years) and 3.8% (one year), this route highlights expanding market opportunities.
Frontier’s ability to maintain or grow market share in these regions indicates effective route prioritization and customer retention.
Challenges
Some routes, despite high volumes, show signs of stagnation or decline:
- Denver-Orlando (254,000 passengers, 25% market share): The route faced consistent declines, with a -0.5% drop over three years and a significant -3.8% loss in the past year.
- Miami-Philadelphia (345,000 passengers, 23% market share): While growing 4.3% over three years, it lost -2.5% in the last 12 months, pointing to increased competition or strategic shifts.
Frontier’s reliance on key hubs and leisure destinations might explain some fluctuations as the airline adapts its network to balance passenger loads and revenue streams.
The Orlando-Philadelphia route leads in passenger volume with 801,000 passengers, despite showing recent weakness.
Philadelphia-Tampa follows with 447,000 passengers, demonstrating more stable performance with a positive 12-month growth of 2.3%.
This pattern suggests varying degrees of success in route optimization and market competition management among the busiest routes of the frontier.
Featured Image By Clément Alloing | Flickr
Stay tuned with us. Further, follow us on social media for the latest updates.
Join us on Telegram Group for the Latest Aviation Updates. Subsequently, follow us on Google News
Frontier and Allegiant Unveils Many New Routes Across Americas
The post Top 20 Busiest Routes of Frontier Airlines appeared first on Aviation A2Z.


