The High-Beta Melt-Up: Echoes Of 1999
Authored by Michael Lebowitz via RealInvestmentAdvice.com,
In our recent article, “The Magnificent Seven Are Mediocre,” we pondered whether the stock market is entering a melt-up phase, where investors driven by extreme speculative behavior and hopes for exponential returns favor volatile stocks with high betas.
To be clear, we do not know whether we are in a melt-up phase. The market could simply be showing a short-term appetite for risk. Importantly, even if this is a melt-up phase, we don’t know whether we are close to the end or if it still has plenty of gains ahead.
What we do know is that, starting from the April lows, the market’s attitude toward riskier, more speculative activities has become much more intense. We also know this phase will eventually end. It could end with a broad market meltdown and a high beta bust, similar to the dot-com era. Alternatively, the broader stock indexes might hold up reasonably well as the lower beta, more value-oriented stocks offset the losses from the more speculative assets.

To help us better assess the situation, we review the 1999 dot-com melt-up for clues, as there are some striking similarities between then and today worth studying.
Party Like It’s 1999
They say, 2000-00, party over
Oops, out of time
So tonight I’m gonna party like it’s 1999
Yeah, yeah
Prince’s lyrics, written in 1982, describe a party ending at the turn of the millennium. While he was not writing about stocks, the lyrics turned out to be insightful, as the stock market party ended shortly after the year 2000 began.
The economic benefits, potential profits, and hype from the internet became increasingly evident to investors in the second half of the 1990s. From 1995 to its peak in early 2000, the S&P 500 rose by over 200%. It wasn’t a straight line up. In the summer and fall of 1998, the failure of the Long Term Capital hedge fund and the Russian default caused the market to decline by approximately 20%.
From the low point on October 8, 1998, to its peak in March 2000, the market experienced a meteoric rebound, gaining nearly 70%.
Lifetime Returns In One Year
While the returns for the indexes and some of the larger, more established tech stocks were impressive, what stood out was the sudden shift in market sentiment. After the downturn in 1998, the riskiest and most speculative stocks with the highest betas became the leaders. Consider the following one-year percentage gains for 1999:
-
Qualcomm (QCOM) +2,619%
-
Commerce One (CMRC) +2707%
-
BroadVision (BVSN) +1,494%
-
Metricom (MCOM) +1,416%
Investors flipped a switch in October 1998 and poured money into stocks with “dot.com” in their names or investments in the internet. Some investors who took profits, realizing the party was getting long in the tooth, made stupendous profits. However, most investors chasing the leaders stayed at the party too long and ultimately paid a dear price.
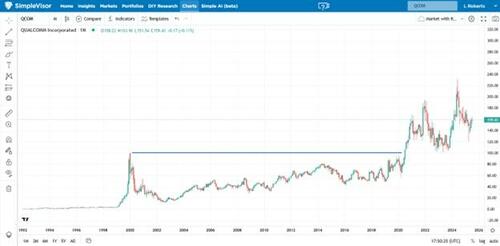
Of the four examples listed above, Commerce One and Metricom filed for bankruptcy shortly after the dotcom bust. BroadVision was delisted as it could not meet NASDAQ reporting requirements. Qualcomm is the only company among those that is still in operation. However, as the graph below illustrates, it took 20 years for the stock price to return to its record high from January 2020. Even Microsoft, the largest stock by market capitalization in 1999, and one that also saw tremendous returns in the late 1990s, spent the next 13 years before regaining its record highs.
1999 – The Chase For Beta
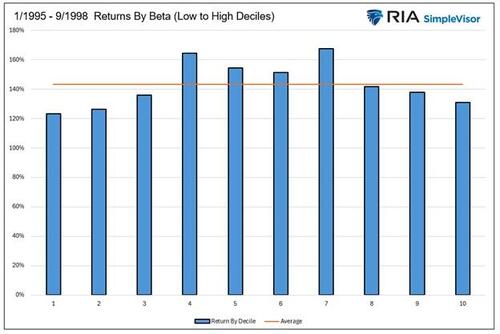
From 1995 to September 1998, the market experienced a broad rally with healthy participation from all types of stocks. The graph below breaks out the percentage returns over that period by deciles of stock beta. As shown, the returns were relatively comparable to one another. Interestingly, the stocks with the lowest and highest betas were below the average.
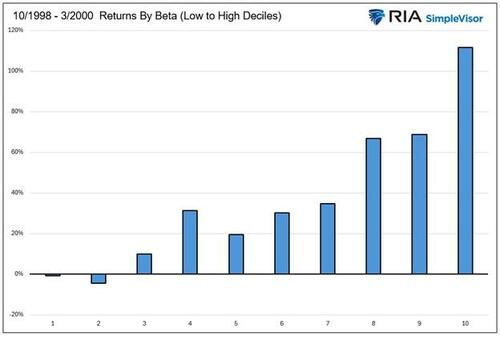
Following the 20% decline in the summer and early fall of 1998, the market tone shifted significantly. The graph below shows investors flocked to the highest beta stocks while avoiding the lowest beta stocks. The 10% of stocks in the highest decile increased by over 100% on average. Meanwhile, the lowest 20% of stocks by beta declined slightly.
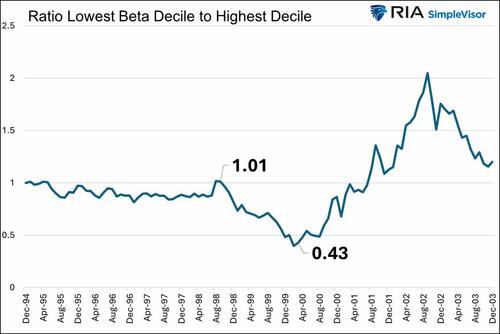
Another way to illustrate the stark return differential is through the ratio of a price index of the lowest beta decile to that of the highest beta decile. As we share below, the ratio was little changed from 1995 through September 1998. By March 2000, one and a half years after the melt-up began, the ratio had been halved, as high beta stocks had significantly outperformed low beta stocks. It’s worth adding that the ratio reversed meaningfully after March 2000. While a story for another article, that does provide a clue on how to shift assets when a melt-up nears midnight.
The Current Melt Up: Low vs. High Beta
Having witnessed the 1999 melt-up and subsequent melt-down of high beta stocks, there is something eerily familiar about the current environment. Similar to 1998, the market recently experienced a sharp decline following a period with a strong upward trend. The culprit for the drawdown was the imposition of tariffs. From mid-February to early April, the S&P 500 fell by nearly 15%. The decline and recovery happened quickly.
However, what has become clear in the rebound is that the market leaders of 2023 and 2024, including many of the Magnificent Seven and some other large-cap stocks with strong earnings and revenue growth, are no longer in control. Speculative stocks involved in AI and cryptocurrencies seem to be in favor. While some of these companies are profitable, many are losing money or are highly indebted. Regardless, investors are captivated by their potential earnings and revenue growth. Even more likely, they are rushing to chase impressive gains and the hope of more to come.
2025 Melt Up Analysis
The graphs above from the 1990s relied on monthly data from Kenneth French and Dartmouth. Because the period we are studying now is much shorter and the monthly data we used previously is delayed by a month, we instead rely on the daily prices of the Invesco High Beta ETF (SPHB) and Low Volatility (SPLV) ETFs. We understand that using different data sources compared to the experience of the 1990s is not ideal. Still, we are confident that the two ETFs and their daily data provide an accurate representation of the current environment.
The graph below charts the relative performance of the high and low beta ETFs (SPHB and SPLV) and large-cap growth (IVW). It shows that the large-cap growth ETF has outperformed the market since 2023 while the low and high beta ETFs generally underperformed. However, since the market low on April 8, 2025, high beta has outperformed the market by over 20%. Further, it beat the once-leading high-growth ETF by 13% and the low-beta ETF by nearly 40%.
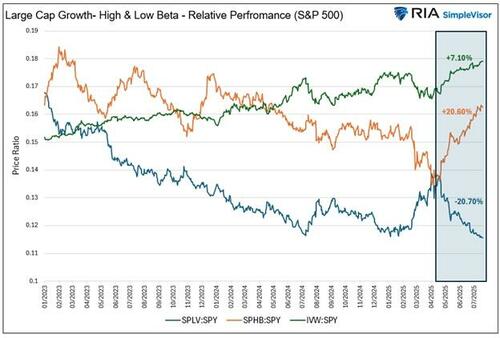
The pursuit of high beta and the avoidance of low beta began at that April low.
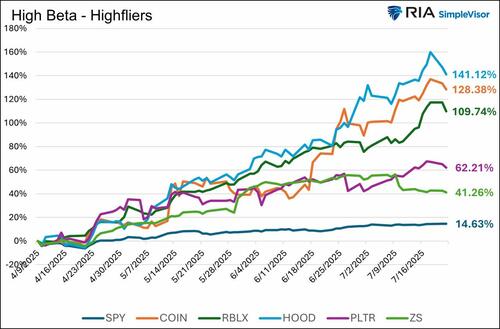
A Few High Beta High Fliers
We highlight a few high beta stocks and their gains since April 8, 2025, to illustrate what the new speculative market leadership looks like.
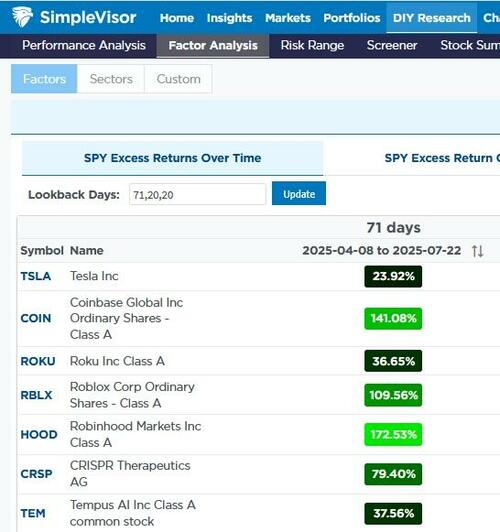
Additionally, the ARK Innovation ETF (ARKK) holds many high-beta stocks that have performed exceptionally well over the past few months. To wit, ARKK has beaten the S&P 500 by 59.70% since April 8, 2025. Its top five holdings (TSLA, COIN, ROKU, RBLX, HOOD, CRSP, and TEM), which account for nearly 50% of its assets, are up significantly, as shown in the screenshot from SimpleVisor below.
Summary
Is this period different from the high beta boom-and-bust cycle during the dot-com era? Only time will tell. While there are some similarities, key differences exist. For one, the internet is now mature, and AI is fueling much of the stock trading. Information moves much faster today, and trading patterns and sentiment are monitored in real-time and acted upon.
From an economic point of view, our economic growth is slower today than it was 25 years ago. The Fed is conducting QT and keeping rates unusually high currently. In 1998, they cut rates by 3% to help Long Term Capital’s creditors and ease fears from Russia’s default. However, they gradually raised them throughout 1999. Additionally, to prepare against a potential technological failure when the year 2000 arrived, they added substantial liquidity to the banking system. This liquidity probably fueled the high beta market rally late in 1999.
Despite the similarities and differences between the two periods, we can be certain that investors’ behavior has become distinctly more speculative since the April lows. The most urgent questions now are how much longer this wave of risk-taking can continue and how much damage it will cause when it finally ends.
Tyler Durden
Wed, 07/30/2025 – 09:00


![Scheda. Nieznane szerzej pojęcie ze spadków. Z podziału spadku pół na pół robi 30% do 70% [Przykład]](https://g.infor.pl/p/_files/39199000/podwyzki-39198887.jpg)