Kamala Karnage As Market Goes Haywire
One month after the Aug 5 Kamala Karry Trade Krash, we got part 2…
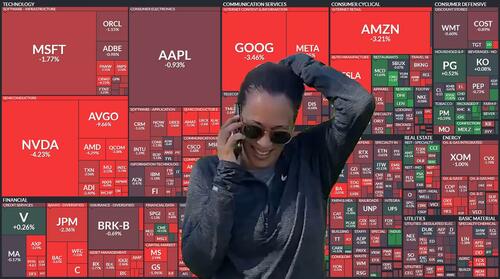
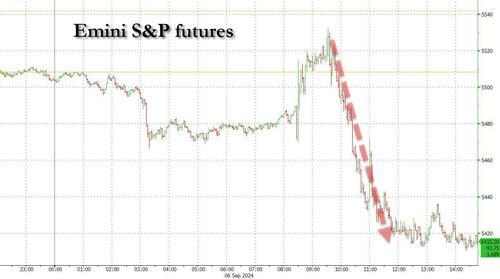
… and boy was it an epic flush: everything – like literally everything – and certainly anything with a high beta or even a trace of momentum, imploded with a sheer violence that made Aug 5 look like amateur hour. And unlike Aug 5, the puke was only at the beginning with stocks spiking from the first moment of trading, this time it was the other way around, with stocks pushing higher to start the day before falling apart, and ending a catastrophic week in the worst way possible: on a downtick.
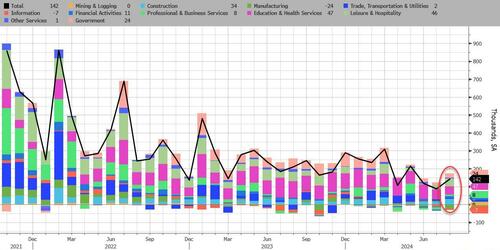
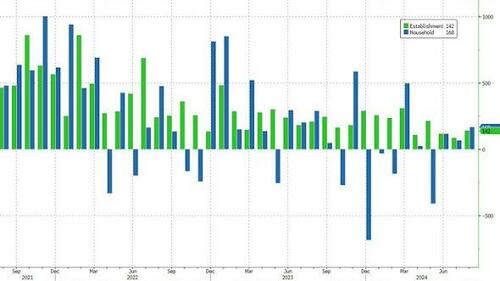
It all started with the August payrolls: as described earlier, the number wasn’t terrible: at 142K, it missed the estimate of 165K but rebounded sharply from last month’s (downward revised) 89K…
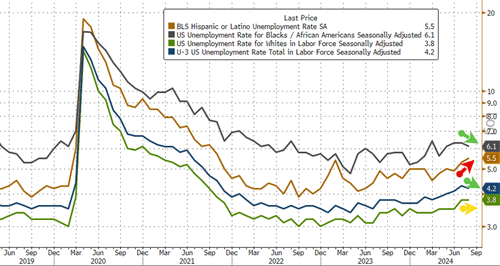
… and the unemployment rate actually dropped…
… as the number of employed workers jumped by the most since March (even if the composition was terrible, consisting entirely of part-time, illegal workers).
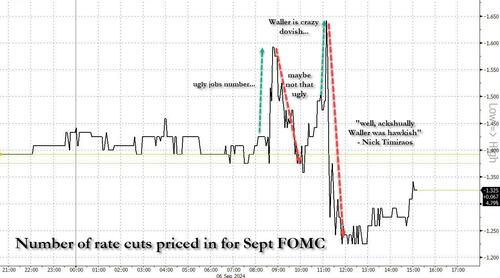
Yet, while on the surface the jobs number was strong enough to eliminate the odds of a 50bps rate cut, the market did not take it that way – perhaps as a result of the massive historical revisions – and odds of a 50bps cut in two weeks first spiked, before reversing… only to spike again after Fed gov Waller said he would „advocate” front-loading rate cuts if that is appropriate, wrong-footing markets again, and sending odds of a 50bps cut as high as 65%… before a tweet from the WSJ’s Fed leaker Nick Timiraos interpreted the Fed’s speech as much more hawkish than it appeared, saying that „Fed governor Chris Waller’s speech doesn’t explicitly say “25” or “50” but it leans into endorsing a 25 bps cut to start, explicitly reserving the option to go faster “as appropriate” if “new data” show more deterioration.”
He also said that „Waller pats the Fed on the back for not overreacting to the banking crisis, the lower inflation prints of 2H 23, the higher prints of Q1 24. Then he says, “Based on the evidence I see, I do not believe the economy is in a recession or necessarily headed for one.” So after all that, we saw what may have been a rate expectation reversal for the ages, with odds of 2 cuts first jumping from 40% to 60% before reversing back to 40%, only to surge to 65% before finally plunging to 25%, all in the span of a few minutes!
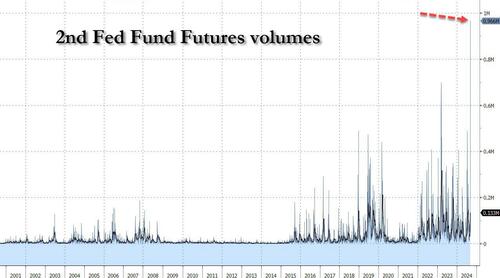
This epic, frenzied activity meant, in which nobody had any idea what is going on, meant Trading in fed funds futures surged to a record Friday. According to Bloomberg, volumes in the second generic fed funds future, typically the most active, reached 900,000 as of 1pm ET, the highest for any contract since their inception in 1988. Trading volume in the October contract surpasses previous record from March 2023, when collapse of Silicon Valley Bank reverberated through financial markets!
And while we don’t know for a fact if that’s what happened, it seems fair to guess that these unprecedented, wild swings in what is the market’s most important pricing indicator, sparked a relentless liquidation across all assets, which hit – in no particular order – stocks…
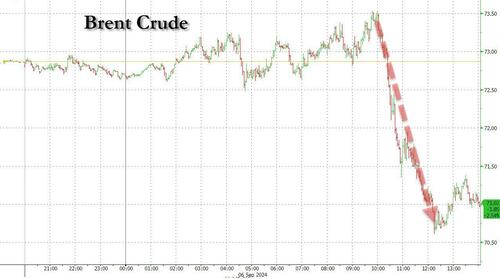
… oil
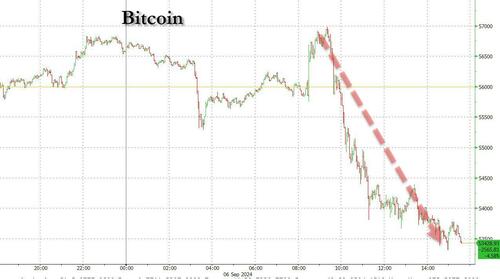
… bitcoin
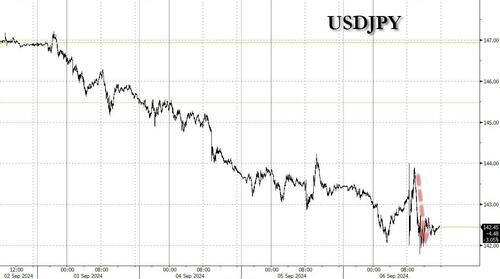
… USDJPY
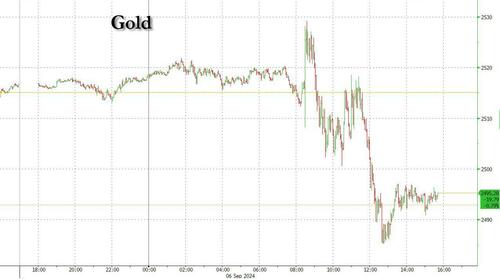
… and even gold was not immune, and after briefly reaching for new all time highs in the aftermath of the payrolls scare, it then proceeded to slide to session lows.
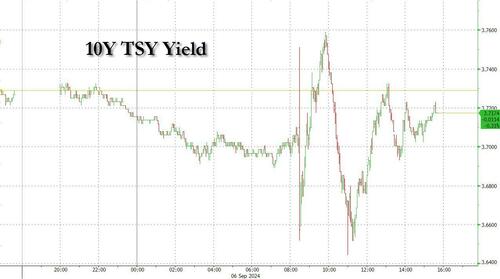
In fact, the only asset class that showed some semblance of rationality was bonds, where yields first dumped, then spiked, then dumped again, only to close near session highs, perhaps realizing that the faster the Fed cuts, the faster it will spark another inflationary conflagration.
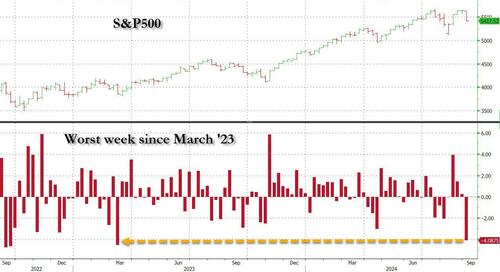
Putting today – and this week’s – rout in context, one can argue that it was even worse than the Aug 5 debacle, because while that was just one day of acute pain, by the end of that particular week, stocks had largely rebounded. This time, however, the pain is just getting started, and what started off as an ugly week, ended up much uglier with widespread liquidations…
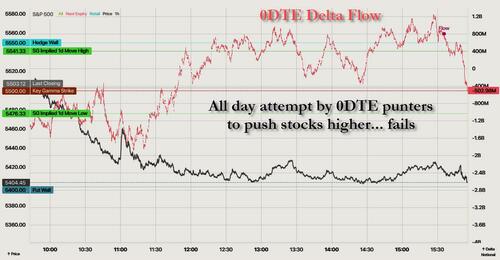
… and even more remarkably, a non-stop attempt by the 0DTE crowd to kickstart an intraday reversal in the form of a record delta flow divergence from the S&P, ended up achieving absolutely nothing.
And how could it when everyone’s favorite high beta momentum stock, NVDA, resumed its plunge and just barely managed to remain above $100, and now down more 30% from its all time high hit all the way back in June…
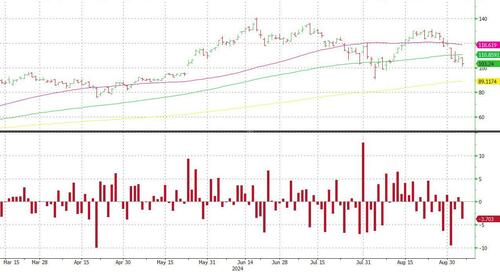
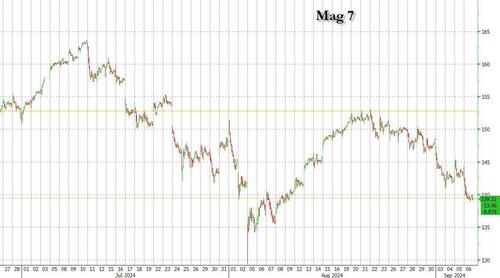
… and not just NVDA, but the entire Mag 7 sector is now back to levels last seen just after the Aug 5 freakout…
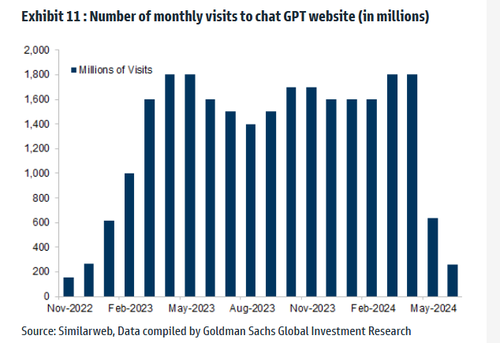
… which may largely be due to charts like this one from Goldman, suggesting that the AI bubble has burst with a bang.
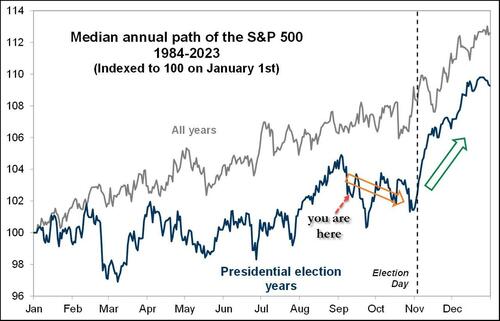
And while it is easy to speculate and assign a narrative to what happened based on prices, it is just as likely that today’s – and this week’s – price action is precisely what was expected to happen: as the following chart from Goldman makes clear, in presidential election years, stocks peak just before Labor day, before dumping all the way until the election, before blasting off higher once more. Well, you are here!
Tyler Durden
Fri, 09/06/2024 – 16:06

