Investor Greed Returns With A Vengeance
Authored by Lance Roberts via RealInvestm,entAdvice.com,
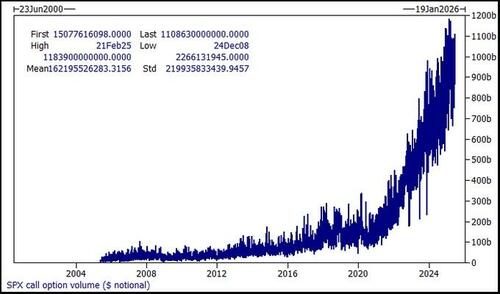
Retail investor greed again dominates market activity, echoing some of the same speculative behaviors seen during previous risk-on phases. Retail investors show heightened risk appetite across multiple metrics, from options trading to leveraged ETF flows, with little regard for valuation or macroeconomic headwinds.
Put/call ratios are flashing strong bullish sentiment, with the SPY ratio hovering around 0.79, reflecting an imbalance toward calls over puts.
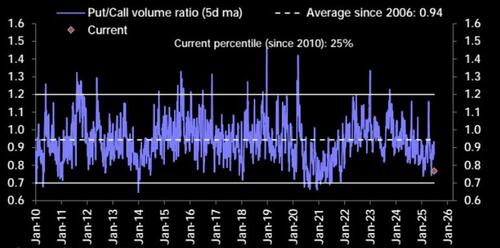
Investor greed primarily drives this skew, particularly in names and sectors associated with high momentum or popular narratives.
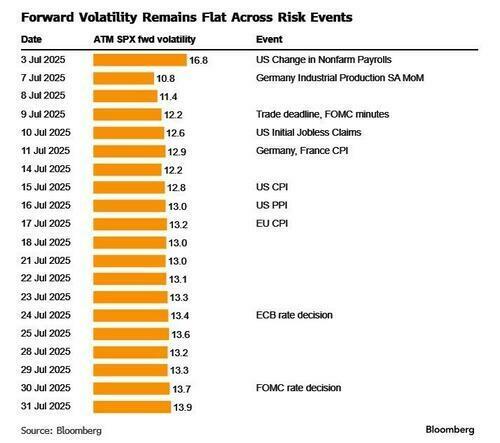
“Despite the looming July 9th trade negotiation deadline, not much is priced into the SPX vol surface for the event, suggesting investors either expect a positive resolution or for the deadline to be extended. Interestingly, the flattening in skew was mostly concentrated in the front-month, suggesting this was mostly positioning-driven FOMO-type call buying. Longer-dated skew remains steep in comparison.” – CBOE
The surge in call option volumes has occurred across semiconductor plays, especially in leveraged vehicles like SOXL, the 3x bullish semiconductor ETF, where open interest in call options far exceeds puts. Similar patterns are emerging in thematic ETFs like RETL (3x retail) and DRN (3x real estate), which are seeing elevated daily volume despite mixed performance. This appetite for leverage is being pushed further with the proliferation of single-stock leveraged ETFs, such as HIMZ, a leveraged play on HIMS, which saw a dramatic 70% collapse after a corporate announcement, highlighting how retail speculation often ignores risk asymmetry.
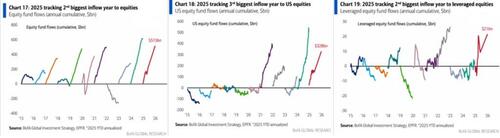
Investor greed is also evident in flows to speculative and penny stocks. Retail inflows into U.S. equities have topped $70 billion year-to-date, with much of that concentrated in highly volatile names like Palantir, MicroStrategy, and other crypto-adjacent or AI-linked plays. Penny stocks and small caps, traditionally the domain of risk-seeking traders, have also seen outsized gains in short bursts, primarily driven by social media chatter and retail momentum chasing. At the same time, investors are doubling down on speculative trades even after short-term losses, reflecting a “buy-the-dip” mindset that prioritizes quick returns over fundamental analysis.
Supporting this activity are broader ETF flow dynamics. Retail-focused providers like Vanguard have seen their share of total U.S. ETF inflows jump to 37%, up from 27% a year earlier. Leveraged equity ETF flows reached a five-year high this past spring and have remained elevated through Q2. Meanwhile, tighter bid-ask spreads and more retail-accessible platforms are enabling higher trade volume with lower friction, further fueling this behavior.
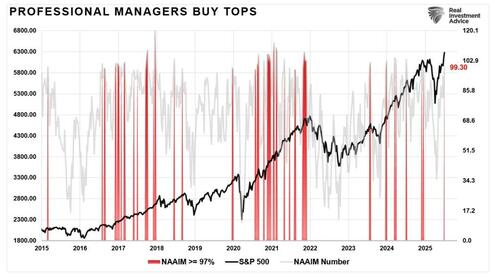
However, it isn’t just retail investor greed driving the market. While a bit late to the party, professional investor sentiment and positioning have surged higher, helping the recent push of the markets to all-time highs.
While retail and professional exuberance fueled the market’s rise, it also introduces fragility. Leveraged ETFs suffer from compounding decay in volatile markets, and speculative trades can unwind violently, as HIMZ demonstrated. While momentum can extend rallies, the resulting reversals are often sharp when sentiment turns.
Optimism is working in the Bulls’ favor, but the warning signs of overreach are mounting. It won’t take much for a decent price correction, which could begin as soon as next week.
Trade accordingly.
Nasdaq 2025 Tracking 2020
I have noted many times previously that I hate market analogs. The reason is that they require “cherry-picking” starting and ending points to make the correlation. However, there are times when analogs can help display similarities between market performance periods and investor greed or fear. The following chart of the Nasdaq in 2020 and 2025 is a good example of the latter. As shown, the onset of the pandemic led to a 35% decline in March of that year. The market then bottomed and began a sharp rally into the end of 2020, and further in 2021. As shown, in 2025, the Nasdaq is tracing out a similar pattern with the decline in March and early April, and the subsequent rebound through the end of June.
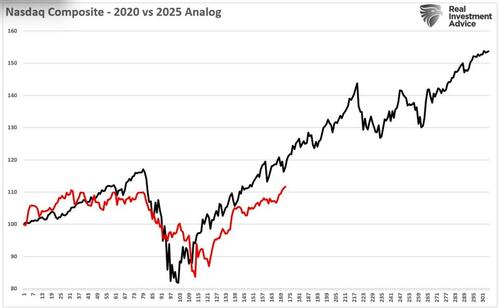
This is undoubtedly an encouraging analogy for the bulls, suggesting that the market has plenty of runway left for the rest of 2025. However, this is why I personally dislike analogs like this because it assumes that just because something occurred in the past, it will repeat identically in the future. The problem is that the analysis lacks the data that supported the previous rally.
The table below details some of the differences between 2020 and today. It is also critical to remember that during 2020, sporting events from football to horse racing were shuttered, leaving only the stock market as a viable outlet for gamblers to place bets. Armed with a Robinhood account, a $1500 stimulus check, and a “bad attitude”, investors flocked into the financial markets chasing some of the speculative corners of the market. Of course, with the Federal Reserve cutting rates to ZERO, injecting a $120 billion a month into the financial system, and ensuring the junk bond market functioned, it is unsurprising that markets quickly recovered from their lows.
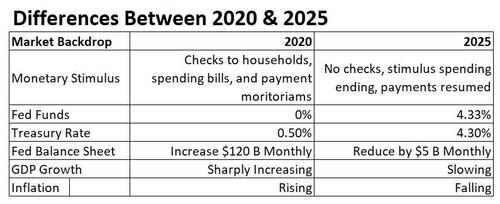
The fascinating thing about 2025 is that the market “feels” much like it did in 2020, but the backdrop is entirely opposite. The Fed is maintaining elevated interest rates, reducing its balance sheet, and fiscal support for the country continues to reverse. Yet, even with monetary and fiscal policy absent, the market is rallying with seemingly the same reckless abandon.
Will the 2025 analog continue to mirror 2020? Maybe. But with valuations elevated and the economy slowing, I would bet that the analog breaks sooner than later.
Be careful taking analogs at face value.
Tyler Durden
Mon, 07/07/2025 – 07:20