Growth And Value Are Not Mutually Exclusive
Authored by Michael Lebowitz via RealInvestmentAdvice.com,
Might Nvidia and Tesla, with price-to-earnings ratios (P/E) nearly double and quadruple that of the S&P 500, respectively, be value stocks? Conversely, is it possible that Ford is not a value stock despite a P/E of 10, a price-to-sales ratio (P/S) of .20, and a 7.5% dividend yield? Based solely on that information, answering the question is impossible. Regardless, we bet most investors classify Nvidia and Tesla as growth stocks and Ford as a value stock.
This article introduces GARP- Growth at a Reasonable Price. As we will detail, by introducing earnings growth expectations into traditional valuation equations, some value stocks may not be quite the gems investors think. Likewise, some growth stocks may be value stocks.

Defining Value And Growth
Investopedia defines a value stock as follows:
A value stock refers to shares of a company that appears to trade at a lower price relative to its fundamentals, such as dividends, earnings, or sales.
By and large, most investors would agree with their definition. Investors often use the word “cheap” when describing value stocks.
Investopedia defines a growth stock as follows:
A growth stock is any share in a company that is anticipated to grow at a rate significantly above the average growth for the market.
Here, too, most investors would approve of Investopedia’s definition. Some may add that growth stocks often boast high valuations.
Value and growth are frequently used terms by investors. Rarely, however, do we hear investors use both descriptors on the same stock. Instead, most investors segregate stocks into one classification or the other. Doing so may cloud their analysis, thus limiting the potential stocks that can meet their objectives and others that may fall short of their expectations.
The PEG Ratio
Listed below are some popular equity valuation metrics:
-
Price to Earnings (P/E)
-
Price to Forward Earnings (P/FE)
-
Price to Sales (P/S)
-
Price to Book Value (P/BV)
-
Price to Free Cash Flow (P/FCF)
The listed per-share ratios are great tools to calibrate how much of a particular fundamental, like earnings or sales, an investor can buy given the share price. While they are essential valuation measures, they lack one of the most critical indicators of future stock performance. They are all based on historical financial data. The one exception is price-to-forward earnings (P/FE). While P/FE is forward-looking, most investors only use one-year earnings growth forecasts to calculate the ratio.
A company’s track record is critical information, but investors should buy or sell stocks based on their future. Thus, expected growth, not just historical growth, should be at the top of investors’ minds.
To assist in stock valuation with expected growth in mind, ratios like the PEG (price/earnings to growth) ratio are beneficial. The PEG ratio divides the standard P/E ratio by the expected growth rate.
Most often, three to five-year expected growth rates are used in the PEG ratio. However, investors can reformulate forward-looking valuations based on any years of growth estimates they choose.
Decomposing PEG
We created the scatter plot below to better understand the PEG ratio. It plots 458 of the S&P 500 stocks. We excluded those with negative or absurdly high forward P/E ratios. The data, courtesy of Zacks, uses its proprietary 3–—to 5-year annualized earnings growth estimates.
Each blue dot represents the intersection of a stock’s one-year forward P/E and its expected annual earnings growth. The black dotted line represents fair value relative to the S&P 500 index. The current forward P/E for the S&P 500 is 24.26, and its expected earnings growth is 15.55%. Thus, its PEG ratio is 1.56 (24.26/15.55). The black dotted line connects all points with an identical PEG ratio. The green line connects all PEG ratios that are equal to 1.0. Traditionally, anything below 1.0 is considered value.
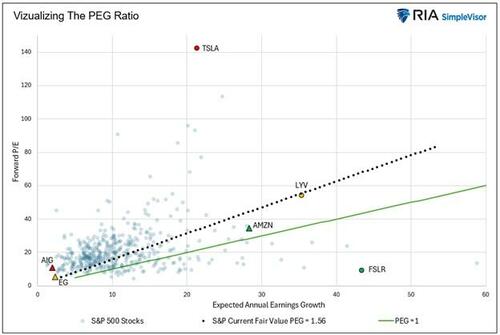
Currently, 29.5% of stocks are cheaper than the S&P 500, i.e., below the black dotted line. Only 12.25% have PEG ratios below 1 (beneath the green line).
Value And Growth May Not Be What We Think
To draw more insights from the graph, we highlight six stocks. They show how the PEG ratio can complement other valuation methods.
AIG (red triangle) has a forward P/E 11, which is well below the S&P 500 and is what many investors would classify as value. However, its expected earnings growth rate is a mere 2%. Thus, its PEG ratio of 5.50 makes it very expensive.
TSLA (red circle) has a forward P/E of 142, representing the highest valuation of those stocks plotted. Despite such a high valuation, its expected growth rate is only 21%, not much more than the index’s 15.5%. Either investors think that earnings growth will be over four times Zack’s expectations, or Tesla is grossly overvalued. Suppose Tesla matches Elon Musk’s prediction that it will have a market cap greater than the five current largest companies combined. In that case, its annual growth rate may ultimately be multiples of Zack’s forecast; thus, currently, it may be a value stock.
AMZN (green triangle) has a higher-than-market forward P/E of 28. However, its growth expectations of 35% are almost double the expected growth rate of the S&P 500 (18%). Therefore, AMZN is a value stock despite its higher-than-market valuation and its exceptional expected growth rate.
FSLR (green circle) has a very low forward P/E of 9 and an expected annualized growth rate of 43%. Based on this data, FSLR is a deep-value growth stock. Also, note that its PEG of .20 is well below the traditional 1% value indicator.
EG (orange triangle) has a low forward P/E of 5. Such is likely due to its low expected growth rate of 2%. Despite its low valuation and growth rate, EG is fair value to the S&P 500 index with a PEG of 1.56. Based solely on this data, an investor should be indifferent to owning EG and the S&P 500.
LYV (orange circle) has a high forward P/E of 54 and a high expected growth rate. Like EG, it has a PEG in line with the market of 1.56.
Summary
The first paragraph asked whether TSLA, NVDA, and F were value stocks.
We have already shared our analysis of TSLA.
Interestingly, based solely on this data, NVDA is a value stock with a PEG ratio below the S&P 500 and 1.0.
Despite its very low valuations and high dividend yield, Ford has a PEG ratio of 1.86, moderately above the S&P 500 and well above 1.0. Based solely on this analysis, Ford is not a value stock.
Value is in the eye of the beholder and may not be apparent as some may think!
The data we use in this analysis is courtesy of Zack’s. Ideally, using an average of multiple earnings growth projections and your projections provides the most thorough analysis.
Tyler Durden
Wed, 02/12/2025 – 13:05