
Extreme Speculation Has Returned
Authored by Lance Roberts via RealInvestmentAdvice.com,
A Holiday-Shortened Week
Last week, we discussed the increasingly bullish market forecasts for next year. We also noted that the market tends to trade positively heading into the Thanksgiving holiday, to which the market did not disappoint.
For the week, while there was a bit of sloppy trading along the way, the market finished at new highs, eclipsing the 6000 level on Friday. Technically, the market remains in a very bullish setup, holding support at the 20-DMA and then breaking out to new highs. That rally reversed the short-term “sell signal,” which gives the market room to trade higher into the first week of December. The rising trend line from the August lows remains the likely peak to any rally in December, and as noted last week, expect some weakness in the second and third week of December as mutual funds make annual distributions. For now, any corrective action in early December should be bought in anticipation for a rally into year end.
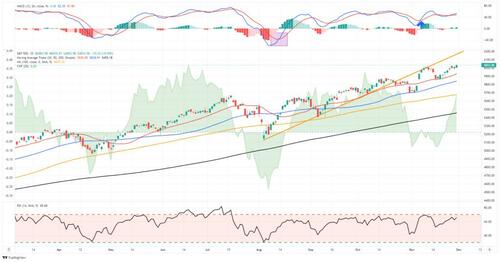
As we discussed previously, the key drivers for December will be continued share repurchases, portfolio manager rebalancing, and window dressing for year-end reporting. These supports will continue into year-end, and with the Federal Reserve likely to cut rates in mid-December, we expect market participants to remain on the “bull train” for now. As suggested last week:
“If you are underweight equities, consider minor pullbacks and consolidations to add exposure as needed to bring portfolios to target weights. Pullbacks will likely be shallow, but being ready to deploy capital will be beneficial. Once we pass the inauguration, we can assess what policies will likely be enacted and adjust portfolios accordingly.”
While there is no reason to be bearish, this does not mean you should abandon risk management. As we will discuss this week, investors are becoming exceedingly optimistic once again.
Investors Are Very Optimistic
I recently wrote an article on how investors have rarely been so “exuberant” in the markets. To wit:
“Consumer confidence in higher stock prices in the next year remains at the highest since 2018, following the 2017 “Trump” tax cuts.“
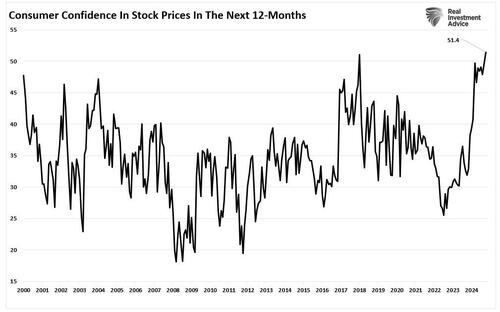
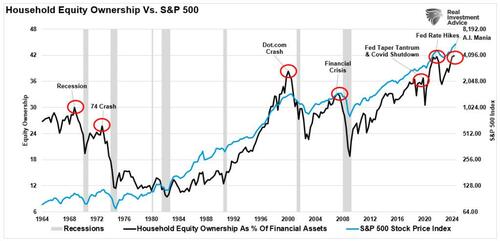
We also discussed households’ allocations to equities, which, according to Federal Reserve data, have reached the highest levels on record.
But we also see exuberance in overall equity allocations in the markets climbing higher with the market.
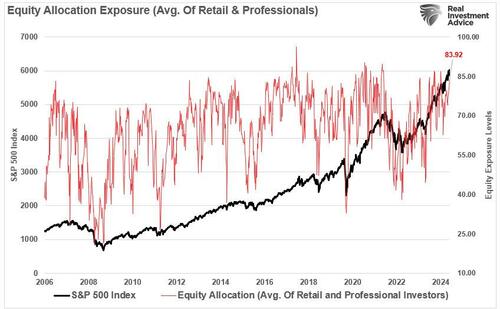
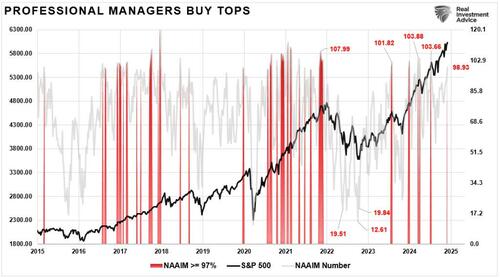
Professional investors are ramping up exposure to chase the market into year-end. The chart below of the NAAIM Index highlights when professional investor allocations exceed 97%. Such has historically been at or near short-term market peaks. In other words, professional investors are no different than retail investors who ” buy tops” and “sell bottoms.”
While allocation levels and optimism are certainly signs of market bullishness, those levels are more of a function of a massive flow of liquidity. In other words, there is “too much money chasing too few assets.” However, it is crucial to understand that “exuberance” is a necessary ingredient for pushing asset prices higher. This is why “sellers live higher, and buyers live lower.” In every market and asset class, the price is determined by supply and demand. If there are more buyers than sellers, then prices rise, and vice-versa. While economic, geopolitical, or financial data points may temporarily affect and shift the balance between those wanting to buy or sell, in the end, the price is solely determined by asset flows.
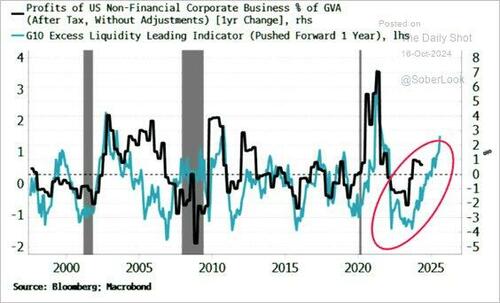
Currently, rising liquidity levels support investor optimism as asset prices continue to rise. However, as we will discuss, such activity does not necessarily equate to more “extreme speculation,” which often precedes significant market corrections. While optimism can drive short-term gains, history shows that extreme speculation detaches valuations from fundamentals, leaving the market vulnerable to larger declines.
As we noted in that previous article:
“Risk isn’t always what it seems. When the market feels the safest, that’s often when it’s often the riskiest. Think about it — when everything is going smoothly, people tend to take more risks, which can lead to market bubbles and crashes.”
However, when investor optimism morphs into more extreme speculative behaviors, investors should consider a more cautious outlook.
Signs Of Extreme Speculation
Following the 2020 pandemic shutdown, the Government and Federal Reserve went into overdrive, providing round after round of fiscal and monetary support. Money flooded into the economy, from PPP Loans to rent moratoriums, $1500 checks directly to consumers, debt forgiveness, zero interest rates, and quantitative easing. Unsurprisingly, much of that money entered the financial markets, and retail investors plowed nearly $900 billion in market-related ETFs. Interestingly, in 2024, most of those supports are gone, interest rates have risen sharply, and the Federal Reserve is reducing its balance sheet. Yet, somehow, investors figured out a way to push $913 billion (YTD) into ETFs, which is a record inflow.
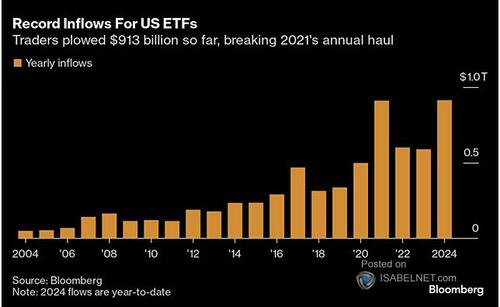
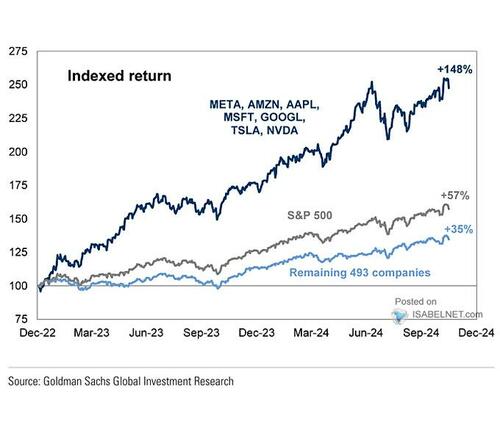
That surge of capital into ETFs has contributed to the outsized performance of large capitalization companies, primarily the “Magnificent 7,” relative to the rest of the index.
However, it is not just U.S. investors dumping money into the financial markets. Foreign investors have also been shifting capital to the U.S. financial markets versus other countries.
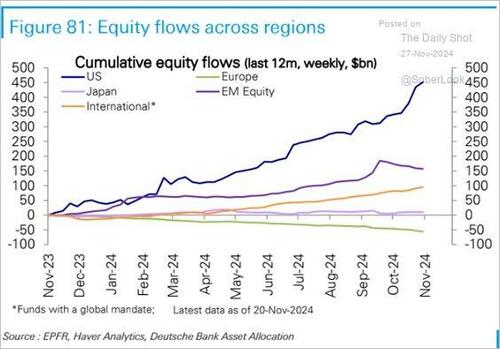
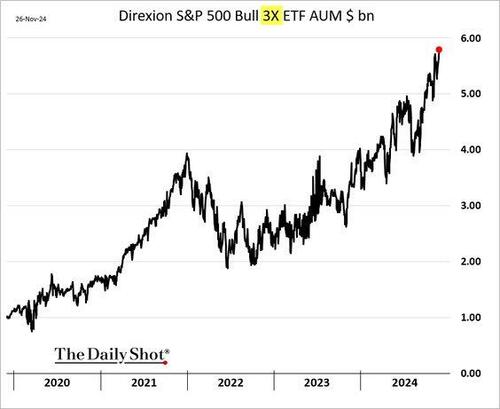
As noted above, there is nothing wrong with investor optimism, which moves markets higher. However, when markets continually rise, even in an environment where they shouldn’t (high interest rates), such leads investors to throw caution to the wind by taking on additional risk. As that risk-taking builds and is rewarded by higher prices, risk-taking morphs into more extreme speculation. For example, the surge of capital into 3x Leveraged S&P 500 ETFs has been remarkable.
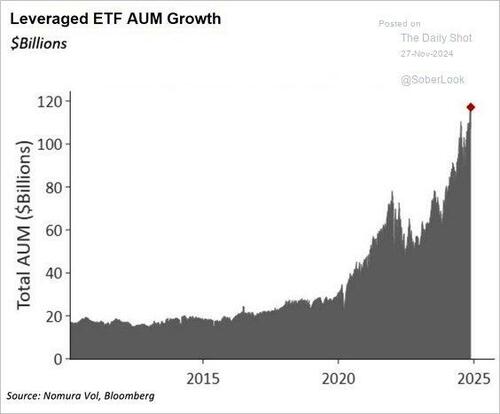
However, it isn’t just that one ETF that investors are aggressively piling funds into. The chart below shows the surge in all levered ETFs.
In addition to the two examples of growing leverage and market speculation, Michael Lebowitz noted in our Daily Market Commentary:
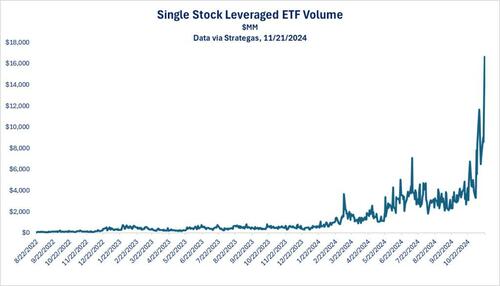
“We see surging volume in leveraged single-stock ETFs. An example of such an ETF is Granite Shares NVDL. The ETF offers a 2x leveraged holding of Nvidia shares. If Nvidia falls by 3%, the ETF will decline by 6%. Conversely, if Nvidia rises by 5%, the ETF will climb 10%. Accordingly, leveraged single-stock ETFs can be incredibly speculative. Furthermore, the massive surge in volume in such ETFs, as we share below, further confirms speculative behaviors are growing.
Leverage and extreme speculation can drive markets higher than most investors forecast. However, in the process, they create a divergence between fundamentals and valuations, thus exposing the markets to risk. Increased leverage and speculation are not reasons to sell immediately, but they indicate that markets are getting frothy, warranting our close attention.“
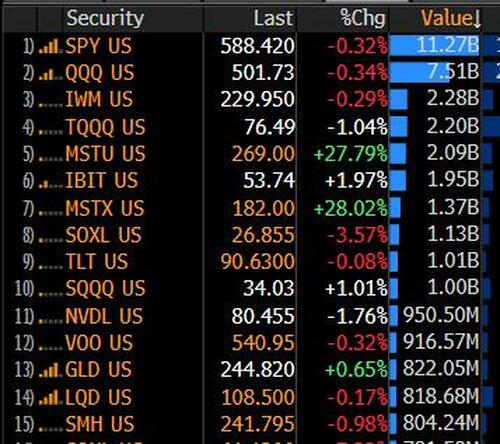
As he notes, the problem with taking on leverage is that while leverage works to your benefit on the way up, it will crush investors on the way down. A good example is the levered 2x Long ETF (MSTU) for Microstrategy (MSTR), the 5th most traded ETF on November 20th.
The problem is that MicroStrategy peaked the following day and has since wiped out a large chunk of that more extreme speculation.
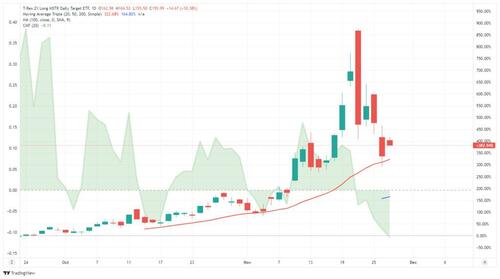
However, such is always the consequence of speculation, and the end results are always poor. While speculation can last for some time, it always does end. Unfortunately, what causes it to end is a failure of the underlying fundamentals to keep up with the fantasy.
Signs To Watch To Signal The End Of Extreme Speculation
This brings us to the obvious question, “What should I be watching for to signal a shift in investor sentiment?”
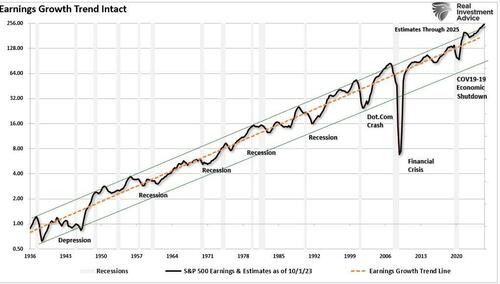
Part of that answer falls into forward earnings expectations. Forward earnings estimates are optimistic and well above their long-term historical logarithmic growth trend. While such deviations existed previously, they were usually close to the point where such optimism ended. The ends of those exuberant periods of earnings growth generally coincided with a recession or a mean-reverting event. However, while estimates are currently very elevated, they can remain that way longer than you think possible.
The timing of an event that reverses extreme speculation is always the most challenging part. However, as discussed this past week, credit spreads can provide us vital clues as to a shift in sentiment that has not yet become apparent in the equity markets. To wit:
“Watching spreads provide insights into the health of the corporate sector, which is a major driver of equity performance. When credit spreads widen, they often lead to lower corporate earnings, economic contraction, and stock market downturns. Widening credit spreads are commonly associated with increased risk aversion among investors. Historically, significant widening of credit spreads has foreshadowed recessions and major market sell-offs. Here’s why:”
-
Corporate Financial Health: Credit spreads reflect investor views on corporate solvency. A rising spread suggests a growing concern over companies’ ability to service their debt. Particularly if the economy slows or interest rates rise.
-
Risk Sentiment Shift: Credit markets tend to be more sensitive to economic shocks than equity markets. When credit spreads widen, it typically indicates that the fixed-income market is pricing in higher risks. This is often a leading indicator of equity market stress.
-
Liquidity Drain: As investors become more risk-averse, they shift capital from corporate bonds to safer assets like Treasuries. The flight to safety reduces liquidity in the corporate bond market. Less liquidity potentially leads to tighter credit conditions that affect businesses’ ability to invest and grow, weighing on stock prices.
Given the exceptionally low spread between corporate and treasury bonds, the bull market remains healthy, so extreme speculation is being rewarded. However, as shown below, such periods ALWAYS end.
“While there are several credit spreads to monitor, the high-yield (or junk bond) spread versus Treasury yields is considered the most reliable. That spread has been a reliable predictor of market corrections and bear markets. The high-yield bond market consists of debt issued by companies with lower credit ratings. Such makes them more vulnerable to economic slowdowns. As such, when investors become concerned about economic prospects, they demand significantly higher returns to hold these riskier bonds. When that happens, the spreads widen warning of increasing risks.
Historically, sharp increases in the high-yield spread have preceded economic recessions and significant market downturns, giving it a high degree of predictive power. According to research by the Federal Reserve and other financial institutions, the high-yield spread has successfully anticipated every U.S. recession since the 1970s. Typically, a widening of this spread by more than 300 basis points (3%) from its recent low has been a strong signal of an impending market correction.”
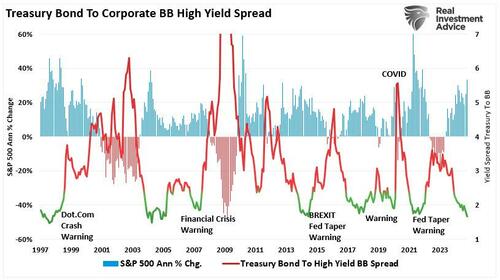
As investors, we suggest monitoring the high-yield spread closely because it tends to be one of the earliest signals that credit markets are beginning to price in higher risks. Unlike stock markets, which can often remain buoyant due to short-term optimism or speculative trading, the credit market is more sensitive to fundamental shifts in economic conditions.
The current bullish sentiment will continue to push asset markets higher in the near term. However, extreme speculation like we are seeing in various areas of the market will eventually end, and likely end badly for most. The timing of the event is the most difficult part.
* * *
Are you looking for complete financial, insurance, and estate planning? Need a risk-managed portfolio management strategy to grow and protect your savings? Whatever your needs are, we are here to help.
Tyler Durden
Sun, 12/01/2024 – 10:30


![Nielisz: Power Sobótka. największą popularnością cieszyły się koncerty [ZDJĘCIA]](https://static2.kronikatygodnia.pl/data/articles/xga-4x3-nielisz-power-sobotka-najwieksza-popularnoscia-cieszyly-sie-koncerty-zdjecia-1751631617.jpg)


