Airports Council International (ACI) World has released its exclusive first look at the 2024 rankings of the busiest airports in the World, with Hartsfield-Jackson Atlanta International Airport (ATL) maintaining its top position followed by Dubai International Airport (DXB) and Dallas Fort Worth International Airport (DFW).
Despite geopolitical and economic challenges, these aviation hubs have demonstrated remarkable resilience, collectively handling approximately 855 million passengers in 2024. Istanbul Airport (IST) secured the surprising 7th position with over 80 million passengers, showing a dramatic 53.4% increase compared to 2019 levels.
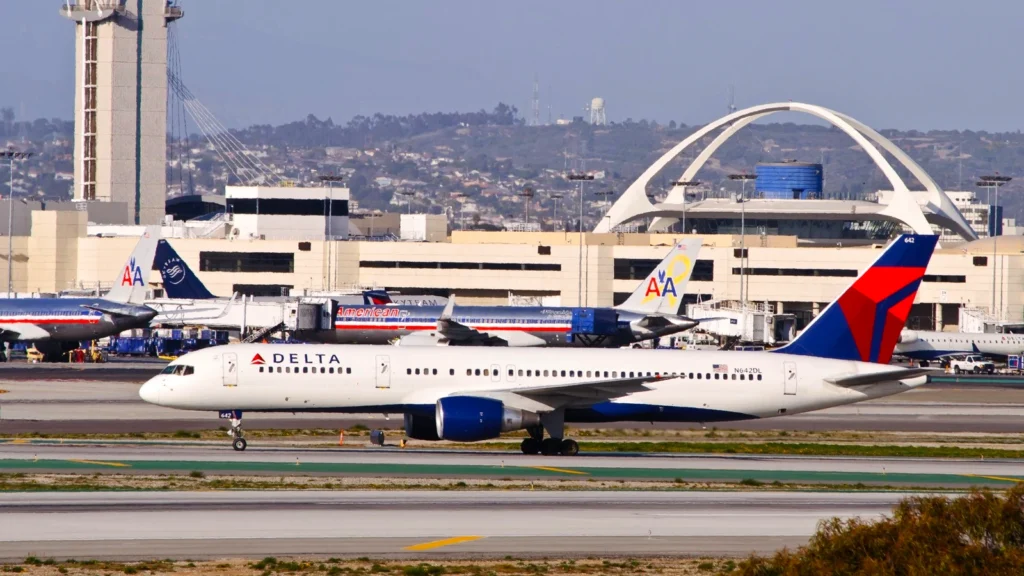 Photo: Scarlet Sappho | Flickr
Busiest Airport in the World 2024
The preliminary figures from ACI World indicate that 2024 global passenger traffic reached nearly 5 billion, representing a 9% increase from 2023 and a 3.8% gain compared to pre-pandemic 2019 levels.
The top 10 busiest airports, which account for 9% of global traffic, experienced an impressive 8.8% growth from 2023 and an 8.4% increase compared to their 2019 results of 789 million passengers.
“Amid global challenges, the resilience of the world’s busiest airports shines,” said ACI World Director General Justin Erbacci.
These hubs are vital arteries of trade, commerce, and connectivity. As air travel grows, ACI World stands ready to support its members, ensuring the smooth flow of people and goods that drive global economic, social, and cultural progress.”
ACI World Director General Justin Erbacci
The 2024 rankings reveal some notable movements among the world’s busiest airports:
- Hartsfield-Jackson Atlanta International Airport (ATL) defended its top position with 108 million passengers
- Dubai International Airport (DXB) maintained second place with 92.3 million passengers
- Dallas Fort Worth International Airport (DFW) climbed to third position from 10th in 2019
- Tokyo Haneda Airport (HND) held steady in the top 5
- London Heathrow Airport (LHR) moved up one spot from 2023
Perhaps the most dramatic rise was Shanghai Pudong International Airport (PVG), which jumped from 21st position in 2023 to 10th in 2024, showing a remarkable 41% year-over-year growth. This leap was fueled by expanded visa policies, the resumption of international flights, operational enhancements, and China’s broader recovery in the Asia-Pacific region.
| 1 | 1 | 1 | ATLANTA, USA (ATL) | 108,067,766 | 3.3 | -2.2 |
| 2 | 2 | 4 | DUBAI, UAE (DXB) | 92,331,506 | 6.1 | 6.9 |
| 3 | 3 | 10 | DALLAS/FORT WORTH, USA (DFW) | 87,817,864 | 7.4 | 17.0 |
| 4 | 5 | 5 | TOKYO, JAPAN (HND) | 85,900,617 | 9.1 | 0.5 |
| 5 | 4 | 7 | LONDON, UK (LHR) | 83,884,572 | 5.9 | 3.7 |
| 6 | 6 | 16 | DENVER, USA (DEN) | 82,358,744 | 5.8 | 19.3 |
| 7 | 7 | 28 | ISTANBUL, TURKEY (IST) | 80,073,252 | 5.3 | 53.4 |
| 8 | 8 | 6 | CHICAGO, USA (ORD) | 80,043,050 | 8.3 | -5.4 |
| 9 | 10 | 17 | NEW DELHI, INDIA (DEL) | 77,820,834 | 7.8 | 13.6 |
| 10 | 21 | 8 | SHANGHAI, CHINA (PVG) | 76,787,039 | 41.0 | 0.8 |
Note: TOTAL PASSENGERS ENPLANED AND DEPLANED, PASSENGERS IN TRANSIT COUNTED ONCE
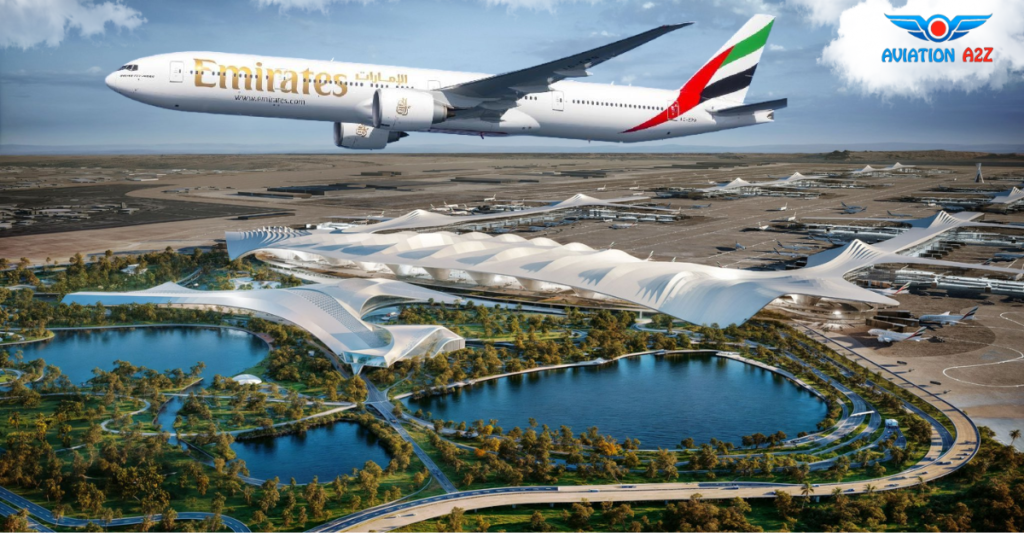 Photo: Compounded by Aviation A2Z
Busiest International Airports in 2024
When looking specifically at international passenger traffic, Dubai (DXB) maintains its dominant position as the world’s busiest international hub with 92.3 million international passengers.
London Heathrow (LHR) secured second place, while Incheon International Airport (ICN) in Korea made a significant jump from 7th to 3rd position with a 26.7% increase over 2023.
Istanbul Airport (IST) continues its impressive growth trajectory, ranking 7th for international traffic with nearly 63 million international passengers—a 59.1% increase compared to 2019. This remarkable performance underscores Turkey’s strategic position as a global connecting hub between Europe, Asia, and Africa.
| 1 | 1 | 1 | DUBAI, UAE (DXB) | 92,331,506 | 6.1 | 7.0 |
| 2 | 2 | 2 | LONDON, UK (LHR) | 79,194,330 | 5.7 | 4.1 |
| 3 | 7 | 5 | INCHEON, KOREA (ICN) | 70,669,246 | 26.7 | 0.1 |
| 4 | 5 | 7 | SINGAPORE, SINGAPORE (SIN) | 67,063,000 | 14.8 | -0.8 |
| 5 | 3 | 3 | AMSTERDAM, NL (AMS) | 66,822,849 | 8.0 | -6.8 |
| 6 | 4 | 6 | PARIS, FRANCE (CDG) | 64,469,356 | 5.0 | -7.7 |
| 7 | 6 | 14 | ISTANBUL, TURKEY (IST) | 62,975,429 | 8.1 | 59.1 |
| 8 | 8 | 8 | FRANKFURT, GERMANY (FRA) | 56,185,219 | 3.9 | -10.9 |
| 9 | 12 | 4 | HONG KONG, HONG KONG SAR (HKG) | 52,949,047 | 34.4 | -25.7 |
| 10 | 9 | 15 | DOHA, QATAR (DOH) | 52,714,976 | 14.8 | 35.9 |
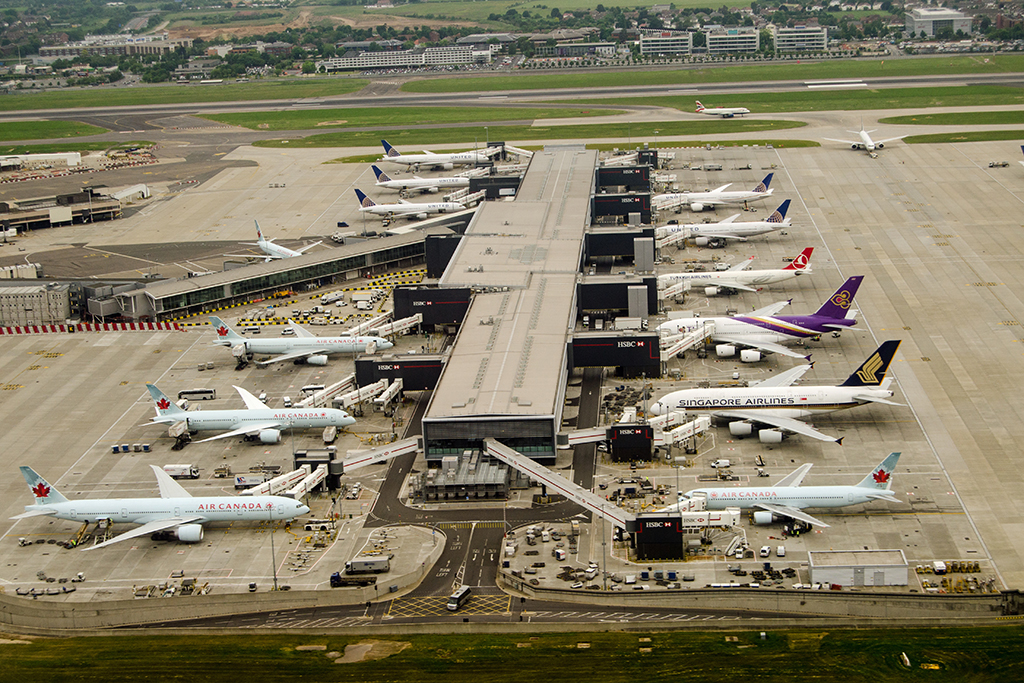 Photo: Ferrovial Construction
Challenges and Future Outlook
The aviation industry faced significant headwinds in 2024, including supply chain challenges from aircraft manufacturers, geopolitical tensions affecting flight routes, and increased operational costs. Despite these obstacles, passenger demand remained robust, though growth is expected to moderate in 2025.
ACI World forecasts global passenger traffic to reach 9.9 billion in 2025, representing a 4.8% year-over-year growth rate. This shift from recovery-driven surges to more structural, long-term growth patterns will require the airport industry to focus on:
- Financial viability and sustainable revenue streams
- Strategic infrastructure investments to address capacity constraints
- Operational efficiency improvements
- Environmental sustainability initiatives
 Photo: Cathay Pacific
Busiest Cargo Airports in the World
Hong Kong International Airport (HKG) reclaimed the top position for air cargo traffic with impressive growth figures.
The recovery trend has been consistent across most major airports, with passenger numbers approaching pre-pandemic levels while cargo volumes have exceeded 2019 figures significantly.
Air cargo volumes increased by 8.4% year-over-year in 2024, reaching over 124 million metric tonnes globally. This represents a 3.9% increase compared to 2019 figures, demonstrating that the cargo sector has not only recovered but expanded beyond pre-pandemic levels.
The top 10 cargo airports handled approximately 32.3 million metric tonnes in 2024, representing nearly 26% of global volumes. These leading airports saw a collective increase of 9.3% compared to 2023 and 9.5% growth versus their 2019 results.
Hong Kong International Airport (HKG) maintained its leadership position, followed by Shanghai Pudong International Airport (PVG) and Memphis International Airport (MEM), the global hub for FedEx Express (FX).
| 1 | 1 | 1 | Hong Kong, Hong Kong SAR (HKG) | 4,938,211 | 14.1 | 2.7 |
| 2 | 3 | 3 | Shanghai, China (PVG) | 3,778,331 | 9.8 | 4.0 |
| 3 | 2 | 2 | Memphis, USA (MEM) | 3,754,236 | -3.3 | -13.2 |
| 4 | 4 | 6 | Anchorage, USA (ANC*) | 3,699,284 | 9.4 | 34.7 |
| 5 | 6 | 4 | Louisville, USA (SDF) | 3,152,969 | 15.6 | 13.0 |
| 6 | 5 | 5 | Incheon, Korea (ICN) | 2,946,902 | 7.4 | 6.6 |
| 7 | 7 | 12 | Miami, USA (MIA) | 2,753,450 | 9.0 | 31.6 |
| 8 | 8 | 8 | Doha, Qatar (DOH) | 2,616,849 | 11.1 | 18.1 |
| 9 | 9 | 17 | Guangzhou, China (CAN) | 2,373,727 | 16.9 | 23.6 |
| 10 | 10 | 9 | Taipei, Taiwan (TPE) | 2,270,974 | 7.5 | 4.1 |
Note: Includes transit freight
Several key factors drove this exceptional cargo growth:
- Explosive e-commerce demand worldwide
- Persistent disruptions in maritime shipping
- Decreased jet fuel prices improving operational economics
- Supply chain diversification strategies
- Increased investment in dedicated cargo facilities
Major cargo carriers like FedEx (FX), UPS (5X), and DHL (D0) have expanded their fleets and operations to meet this heightened demand.
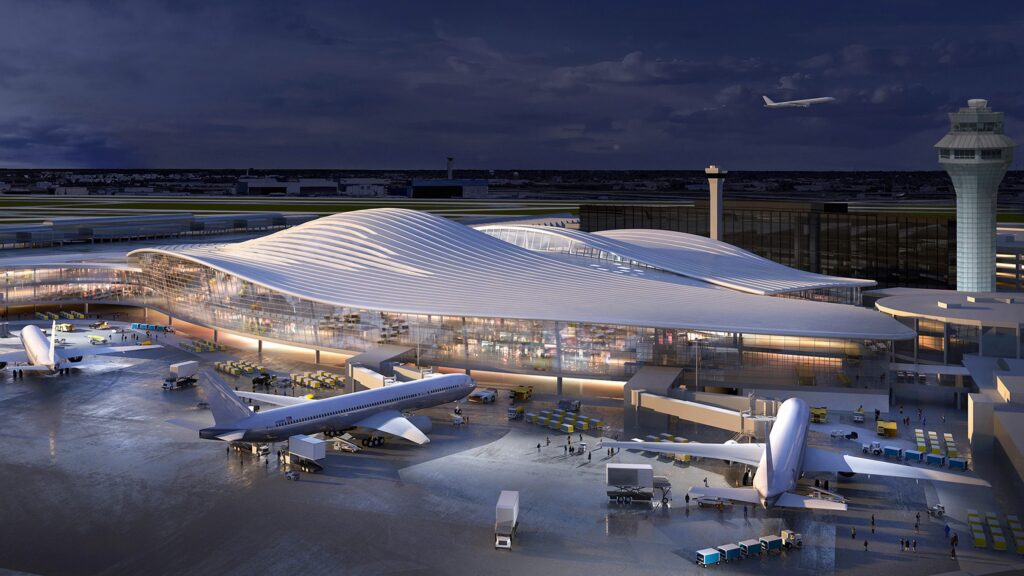 Photo: Fentress-EXP-brook-Garza
Aircraft Movements and Operational Efficiency
Global aircraft movements reached approximately 100 million in 2024, marking a 4.3% increase from 2023 but still slightly below 2019 figures with a recovery rate of 97.4%.
The top 10 airports for aircraft movements, representing over 6% of global traffic with 6.4 million movements, saw a 6.5% increase from 2023 and a marginal 0.4% gain compared to 2019.
Hartsfield-Jackson Atlanta International Airport (ATL) leads this category, followed by Chicago O’Hare International Airport (ORD) and Dallas Fort Worth International Airport (DFW). These airports have implemented various efficiency measures to handle increasing traffic while managing slot constraints:
- Advanced air traffic management systems
- Improved ground handling procedures
- Gate optimization technologies
- Runway usage maximization strategies
- Weather impact mitigation systems
Airlines operating at these hubs, including American Airlines (AA) at DFW and United Airlines (UA) at ORD, have adjusted their scheduling practices to improve operational reliability and reduce congestion during peak periods.
| 1 | 1 | 2 | Atlanta, USA (ATL) | 796,224 | 2.6 | -12.0 |
| 2 | 2 | 1 | Chicago, USA (ORD) | 776,036 | 7.7 | -15.6 |
| 3 | 3 | 3 | Dallas/Fort Worth, USA (DFW) | 743,203 | 7.8 | 3.2 |
| 4 | 4 | 5 | Denver, USA (DEN) | 689,368 | 4.9 | 9.1 |
| 5 | 5 | 8 | Las Vegas, USA (LAS) | 613,973 | 0.4 | 11.0 |
| 6 | 7 | 7 | Charlotte, USA (CLT) | 596,583 | 10.7 | 3.2 |
| 7 | 6 | 4 | Los Angeles, USA (LAX) | 581,779 | 1.2 | -15.8 |
| 8 | 18 | 11 | Shanghai, China (PVG) | 528,074 | 21.7 | 3.2 |
| 9 | 8 | 54 | Istanbul, Turkey (IST) | 517,284 | 2.2 | 56.8 |
| 10 | 14 | 12 | Guangzhou, China (CAN) | 512,004 | 12.3 | 4.2 |
Note: Movements represent landings and takeoffs
Stay tuned with us. Further, follow us on social media for the latest updates.
Join us on Telegram Group for the Latest Aviation Updates. Subsequently, follow us on Google News
Singapore Changi Named Best Airport in the World, No.6 Will Surprise You
The post Busiest Airports in the World 2024, No. 7 Will Surprise You appeared first on Aviation A2Z.