An Unstoppable Bull Market?
Authored by Lane Roberts via RealInvestmentAdvice.com,
Even Trump Can’t Kill The Rally
Last week, we discussed how the rally had repaired much of the previous damage following the correction. As we noted:
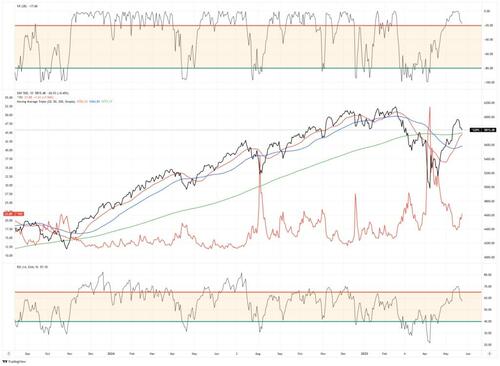
“This past week, the market continued its advance. There is little reason to be bearish with key overhead resistance levels broken. However, as shown, the markets are reaching decently overbought levels after being extremely oversold. This suggests that at least for now, the “easy money” has been made. With the market above the 200, and above the 50 and 20-DMA, pullbacks should be between 5600 and 5800. Investors can use such a pullback to increase portfolio equity exposures and reduce hedges accordingly. Conversely, 5000 to 5200 becomes the next critical target if those lower supports are violated. Notably, such would require some unexpected event to unfold.”
Several times this past week, we discussed that the market was due for a corrective pullback after reaching more overbought conditions. On Friday, the market gave way early in the morning on fresh comments by President Trump instituting 25% tariffs on Apple (AAPL) on any product not manufactured in the U.S. and 50% tariffs on the EU, as trade talks are not going well. As is always the case, amid a bull run, sellers are still unwilling to sell over fear of “missing out” on rising asset prices. It takes some “event” to bring sellers into the market, which we saw early on Friday.
However, by late afternoon, markets bounced off the 200-DMA and clawed their way higher as comments from Scott Bessent took the sting out of Trump’s announcements. Most importantly, he made two significant statements to alleviate concerns over the recent yield rise. First, he expects the US budget deficit “to be something with a 3% in front of it by 2028,” with revenue from tariffs to be used to solve the deficit. This is crucial as the CBO projections of never-ending deficits do not consider the effects of policy changes that can lead to economic growth. Tax cuts, deregulation, the coming productivity boost from Artificial Intelligence, or the infrastructure demand for power can significantly impact future growth rates.
Secondly, he specifically mentioned the SLR. The Supplementary Leverage Ratio (SLR) is a rule imposed after the 2008 financial crisis that increased bank capital requirements. This is particularly interesting to the bond market, where reversing that requirement will allow banks to purchase more Treasury Bonds. Bessent noted in his interview that the Treasury is close to “moving the SLR requirement and could see that move by the summer.” That shift in the SLR requirement is very bond-friendly and will work to bring rates lower. (For more, read our Daily Market Commentary from last week.)
Technically Speaking
Even with Bessent’s comments, that market remains overbought short-term, and a further consolidation process is likely into next week. At the end of this week, we removed our short-market hedge, added to bonds, and reduced equity exposure. If the market is going to consolidate, we can allow cash to act as the primary hedge. However, if the 200-DMA is violated, the 50-DMA will become the next critical support. From a bullish perspective, the 20 and 50-DMAs are now sloping positively, which should provide rising support levels. Overall, we suspect that the market will stabilize. Of course, there are always risks to be aware of, so increased cash levels are essential now.
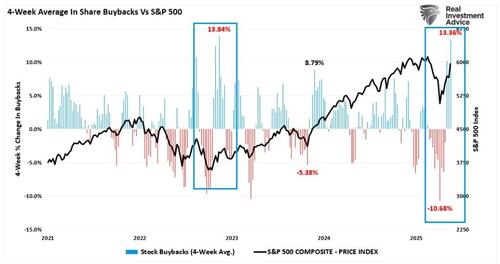
We are not “bearish” on the market because buybacks remain a powerful market influence over the next month. The recent surge has been the largest since the October 2022 market lows. However, those will begin to fade in the middle of June, which could weigh on markets into the Q2 earnings reports.
For now, this seems to be an “unstoppable” bull market, and investor spirits have become substantially more bullish. However, all rallies eventually end. That doesn’t mean a “crash” is coming, and as noted last week, the market is holding the 200-DMA for now. This suggests the previous correction phase is likely complete with support gathering at slightly lower levels. However, there is never a guarantee, so we have taken some recent gains and raised cash levels. We will be patient for a much better entry point soon.
With that said, let’s discuss how to navigate a seemingly “unstoppable” bull market.
Retail Buyers Go “All In”
Last week, we started the market update by analogy between the COVID pandemic decline and this year’s correction. As we noted:
“It is worth remembering that there are many competing differences between the current macroeconomic backdrop and 2020.”
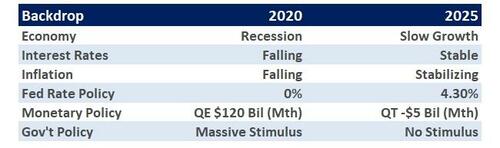
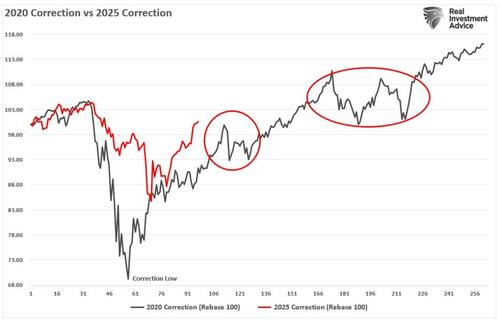
“However, as we discussed in that previous analysis, even a “unstoppable bull market” gives those who can be patient better risk/reward opportunities to increase equity exposures. For example, after the initial rally off the March 2020 lows, the market pulled back and consolidated briefly before rallying further. Then, another longer consolidation process that year provided another entry point for bullish investors.”
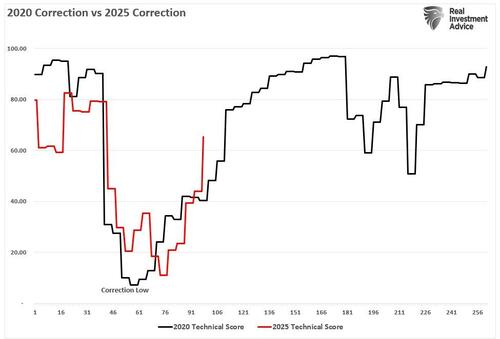
“The weekly Technical Gauge we produce each week in this newsletter below follows the same path as 2020. While not yet back to bullish technical extremes, it is moving quickly higher to more elevated levels. When those readings reached 80, the market went through a longer consolidation process in 2020.”
Most interesting is that retail investors have been fueling the market’s advance. As noted in our #DailyMarketCommentary:
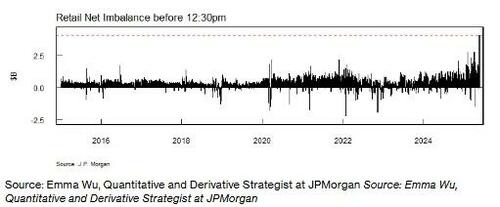
“Monday was a record-setting day. Stocks opened down 1% on news that Moody’s downgraded the US credit rating to AA. While some perceived the downgrade as problematic, retail investors, aka individuals, bought stocks at the highest rate ever. Per JP Morgan, retail investors purchased a net of $4.1 billion of US stocks in the first three hours of trading. As their graph below shows, Monday’s retail buying stampede dwarfs prior instances”
While the retail net inflow was quite impressive, it does leave the bulls and bears with a consideration. We should ask ourselves who the retail investors bought the stock from. The answer, by default, is institutional investors. This trend of retail buying from institutional investors has been ongoing. As we wrote in “Smart Money or Dumb Money: Who Will be Right?“
Smart money (institutions and hedge funds) is aggressively selling this market while individual investors, aka dumb money, are aggressively buying. The difference in opinions is stunning.
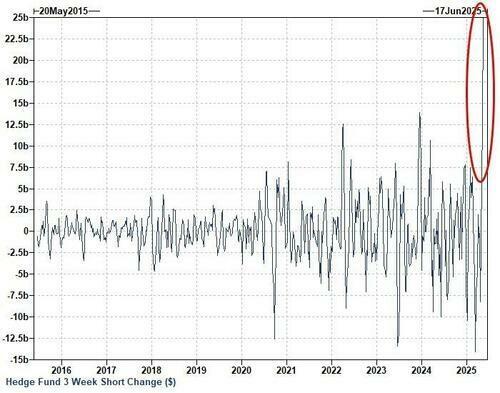
The data below confirms that view, with the recent stretch of Hedge Fund short selling remaining unprecedented and reflective of some skeptics. Over the past 3 COT reports, Hedge Fund shorts surged ~$25bn – the largest amount for at least the past 10 years.
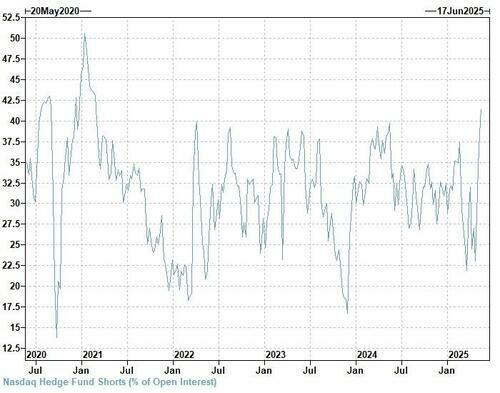
Viewed through another lens, Hedge Fund shorts as a percentage of total open interest reached 41% – the max dating back to February of 2021.
Typically, institutional investors tend to be right. However, in the short term, particularly over the last few years, retail investors have been heavy buyers of corrections. The only question is whether retail investors run out of money before institutions are forced to cover?
Valuations Take A Back Seat
That said, the rally so far seems unstoppable. Every time the market opens lower, as on Friday following Trump’s tariff increase, buyers step in. As such, the patience needed to wait for a correction has been hard to come by. As noted previously, we remain bullishly biased but expect a pullback.
“We must remember that market advances can only go so far before an eventual correction occurs. My best guess is that if the markets are to reach all-time highs this year, we will likely have a correction to reset some of the more extreme overbought conditions, as shown below. Any pullback to the 50-DMA is likely a good entry point to increase exposure on a better risk/reward basis.”
The bull market that started in October 2022 has surprised many, given the number of traditionally more bearish indicators, such as inverted yield curves, leading economic indicators, and rising interest rates. For many individuals, trading a rising stock market is difficult because they expect the inevitable resumption of the “bear market.” However, as the market continues to rise, investors are pressured to buy equities, creating more demand, thereby pushing asset prices even higher.
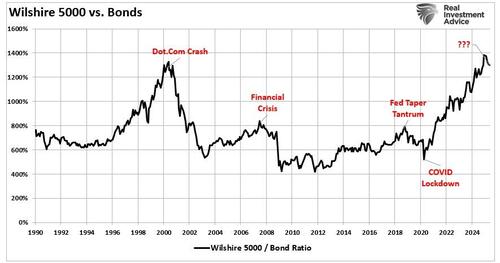
The bullish bias is evident in the long-term relationship between stocks and bonds. The ratio of stocks to bonds has far exceeded that of the “Financial Crisis,” and is now on par with the “Dot.com” bubble peak, with a similar sharp slope higher.
Does that mean the market is about to “crash?” No, but there is an apparent correlation between the detachment of stocks to bonds and historical valuation metrics. However, in the short term, all that matters is price. As discussed in “Technical Measures,“ valuations are a terrible market timing tool. Valuations only measure when prices are moving faster or slower than earnings. In the short term, valuations are just a measure of psychology. To wit:
“Valuation metrics are just that – a measure of current valuation. More importantly, when valuation metrics are excessive, it is a better measure of ‘investor psychology’ and the manifestation of the ‘greater fool theory.’ As shown, there is a high correlation between our composite consumer confidence index and trailing 1-year S&P 500 valuations.”
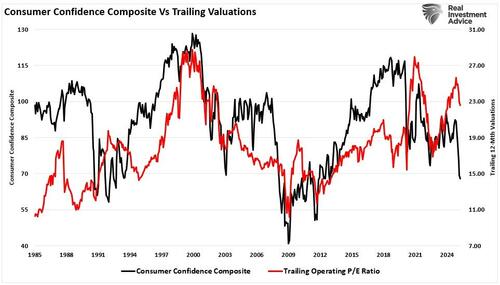
The chart indeed suggests that investors should sell everything immediately. However, given that this is monthly data, these turns can and do take much longer than expected. This “lag” leads investors in the short term to believe that “valuations” no longer matter. Such is a dangerous assumption that investors paid dearly for in the past. Valuations do matter, and they matter a lot, just not today.
Therefore, when investors are caught in an “unstoppable” bull market, we must revert to price analysis and trading rules to navigate the markets.
Navigating An Unstoppable Bull Market
There are millions of ways to approach technical analysis, and investors use millions of combinations of technical indicators to decipher market movements.
I am only going to discuss how we do it with you.
Notably, technical analysis does NOT predict the future. It is the study of historical price action, which is the purest representation of the psychology of market participants. From that study, we can make statistical observations about the behavior of market participants in the past. Those assumptions can help form a “guess,” assuming similar variables, about how they may act in the near term.
For our portfolio management needs, we keep our analysis very simple. We use one indicator to indicate if prices are overbought or oversold, two moving averages to determine the trend of prices, and Bollinger bands to warn of significant deviations from those moving averages. I show the technical setup in the sample chart below from SimpleVisor.com.
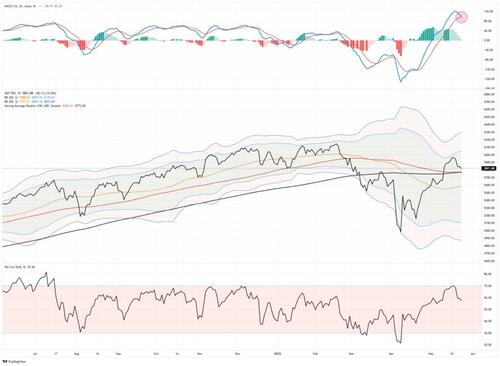
When markets rise, we look for “warning signs” that stocks could be due for a short—or intermediate-term corrective period. Conversely, during market declines, we look for indications that markets are oversold and ready to advance. Currently, we are dealing with the former.
Historically, when prices move toward the upper bands of 2- or 3-standard deviations above the 50-day moving average (dma), the Williams %R is overbought, and the MACD is crossing lower from a high level, stock prices generally correct to some degree. Such is the potential environment we will likely deal with in the next few weeks as earnings season concludes and the corporate buyback window closes. This is also why we have suggested holding off trading portfolios and increasing cash levels until some of these more overbought conditions are corrected.
But that is difficult to do in an “unstoppable” market advance.
Trading An Unstoppable Market
It’s not as hard as you think, once you conquer the emotional side of the equation.
Commandment #1: “Thou Shall Not Trade Against the Trend.” – James P. Arthur Huprich
Let me be very clear. We are discussing risk management. You must understand the market’s overall trend and when it is changing. The negative price trend of 2022 is now over, and since then, the market has continued to trend positively. While you can argue, fight, and provide all the reasons why “the game is rigged,” the fact is that the market continues to push higher. Those participating are building wealth, those who aren’t…well…aren’t. You have a choice.
We are in a “bull market.”. As such, we want to maintain our exposure to equity risk. However, this does not mean we should ignore what the market tells us and let the ebbs and flows wash over us. Eventually, another “ebb” will come, and we will want to reduce risk accordingly. That does not mean selling everything and going to cash.
“In a bull market, you can be either long or neutral. In a bear market, you can only be neutral or short.” – Dennis Gartman
The market will eventually pull back, and likely soon. During that correction, prices will likely remain confined to the 50-dma, as noted above. Could a correction be larger? Yes. The market is currently overbought and extended, so we suggest that investors manage risk and remain cautious about committing cash reserves to the market. However, we will want to use corrections that reverse those overbought and extended conditions as an opportunity to increase equity exposure.
“Willingness and ability to hold funds uninvested while awaiting real opportunities is a key to success in the battle for investment survival.” – Gerald Loeb
Tyler Durden
Sun, 05/25/2025 – 10:30