1970s, 2000s, 2020s… A Déjà Vu In Two Acts – Second Act
Authored by Ronnie Stoeferle via VonGreyerz.gold,
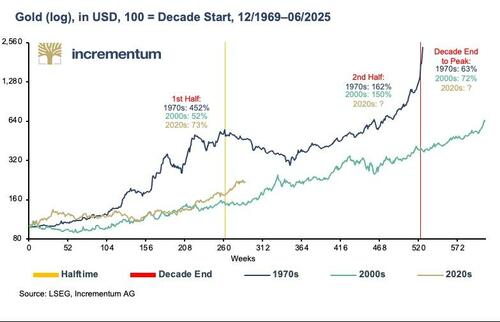
Since the price of gold was freed by the final separation of sovereign currencies from gold following the closure of the gold window on August 15, 1971, gold has experienced three bull markets: in the 1970s, in the 2000s and in the current decade. A comparison of these three major gold bull markets shows that history does not repeat itself: History does not repeat itself, but it does rhyme. Despite various differences, the structural similarities in the underlying conditions outweigh the differences. In the past two decades, gold proved to be a safe haven in the midst of inflation, economic turmoil and confidence crises and recorded enormous gains during these golden decades. Many of the factors that fueled the price of gold at that time, from negative real interest rates and excessive money supply growth to geopolitical tensions, are also present again in the 2020s. Developments in the first half of the 2020s support the theory that we are experiencing déjà vu and that the 2020s could become the third golden decade. Gold has already reached numerous historic highs in all currencies.
Gold’s performance has been particularly impressive over the past 1 ½ years. In 2024, gold gained 28.9% in US dollars, 35.6% in euros and 37.1% in Swiss francs. In the first half of 2025, gold achieved a further gain of 25.6% in US dollars, 10.5% in euros and 9.8% in Swiss francs. This results in a total gain of 61.9% in US dollars, 49.8% in euros and 50.4% in Swiss francs. This means that gold has outperformed almost all leading share indices over the past 18 months by a wide or very wide margin.
The historical comparison is promising
The second half of the past two gold bull markets showed remarkably similar price dynamics: In the 1970s, the gold price rose by 162%, while in the 2000s it increased by 150%. If the current cycle continues in a similar fashion, the gold price would increase from USD 2,624 at the midpoint of the decade at the end of December 2024 to around USD 6,800 by the end of the decade. In fact, past bull markets have always ended in an overshoot, with prices doubling within around 9 months.
Silver, mining stocks & commodities in general also perform in golden decades
The following table provides an insightful comparison of the compound annual growth rate (CAGR) of gold, silver, mining stocks and commodities over the 1970s, 2000s and 2020s, broken down into first and second halves and for the period as a whole. Even though the data for the second half of the 2020s decade is naturally only available in rudimentary form, some interesting patterns can be identified.
CAGR of Gold, Silver, Mining Stocks, and Commodities in Bull Market Decades, in USD, 12/1969–06/2025
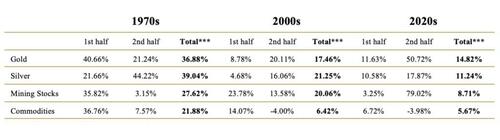
Source: LSEG (as at 06/30/2025), Incrementum AG
*BGMI 12/1969-05/1996, HUI 05/1996- **GSCI Index TR, ***Decade start to high
Gold has been the most stable performer over all three decades. In the 1970s, it achieved an annual gain of over 40% in the first half and still 21% in the second half. The pattern reversed in the 2000s. In the first decade of the new millennium, the second half was much more dynamic, with an annual gain of 20% in the first half and an annual gain of just under 9%. The CAGR development to date in the 2020s is particularly striking: After an annualized return of just under 12% in the first half of the decade, gold has so far achieved an average annual performance of just over 50% in the second half. On the one hand, this extraordinary momentum is due to the still short observation period, which is statistically more susceptible to outliers. On the other hand, it is a clear sign of cyclical momentum. Even if it cannot be assumed that gold will maintain its current pace over the entire second half of the decade, the development impressively underlines the intact upward momentum and the growing interest in the precious metal.
Silver traditionally presents itself as a cyclical laggard with a tendency towards explosive final spurts. In the 1970s, the second half, with an annual return of more than 44% was significantly stronger than the first half, with an annual gain of 21%. A similar pattern emerged in the 2000s. A strong performance has also been observed in the current decade, but the historical parallels suggest that the dynamic part of the cycle is possibly still to come.
Gold mining shares are regarded as a more volatile leverage variant of the gold price, with sometimes spectacular swings. In the 1970s, gold mining shares gained over 35% per year in the first half of the decade, but lost much of their momentum in the second half. In the 2000s, the first half was also much stronger than the second, with annual gains of just under 24%. The 2020s appear to be breaking this pattern for the time being: After a disappointing first half with an average annual gain of just 3.25%, the mining sector is currently recording a comeback with an annualized gain of almost 80% in the second half of the decade.
Commodities show a strongly cyclical picture. In the 1970s, they excelled in the first half with an annual increase of more than 36%, driven by oil price shocks and inflationary pressure. In the 2000s, performance was weaker overall, with the second half even turning negative due to the global financial crisis in 2007/08, bringing the commodity supercycle to an abrupt end. In the 2020s, the first half has so far been rather subdued. The second half began with a setback of almost -4% due to the Trump shock.
The new 60/40 portfolio puts the old 60/40 portfolio in the shade
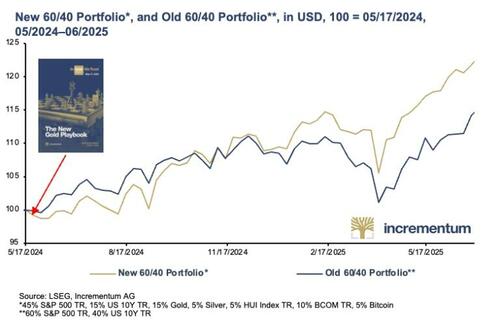
The historical analysis of past bull markets provides impressive evidence: gold, silver, mining stocks, and commodities prove to be particularly resilient in fragile macroeconomic and geopolitical phases. Based on this insight, we presented an enhanced 60/40 portfolio as a modern, more robustly structured alternative to the traditional model in last year’s In Gold We Trust report, The New Gold Playbook. The aim was to take account of the changed framework conditions and outline a modern allocation strategy.
In contrast to the traditional allocation of 60% equities and 40% bonds, the new model deliberately takes into account the changed risk landscape and expands the allocation framework to include liquid, alternative assets that cannot be inflated at will: 45% equities, 15% bonds, 15% safety gold, 10% performance gold, i.e. silver and mining stocks, 10% commodities and 5% bitcoin.
A look at the performance of the last twelve months compared to the classic 60/40 portfolio shows how this rebalancing has worked in practice since the publication of last year’s In Gold We Trust report.
A comparison of the two portfolios over the period from May 2024 to June 2025 shows that the new 60/40 portfolio significantly outperformed its classic counterpart over long stretches. After an initially subdued start, the performance of the new 60/40 portfolio picked up noticeably. While the traditional 60/40 portfolio came under increasing pressure as the year progressed, the new model remained much more stable and resilient, particularly in the volatile market phases of the current year.
The performance advantage over the period under review underpins the thesis that a modern portfolio architecture based on sound money components and inflation-resilient assets is superior to the traditional model, both in terms of stability and return potential. While gold has already reached new all-time highs, silver and mining stocks are still in the slipstream. However, experience shows that they catch up in the late phase of the cycle, which brings additional catch-up potential for performance gold.
Conclusion
Since the final separation of the international monetary system from gold with the closing of the gold window on August 15, 1971 by US President Richard Nixon, gold has enjoyed two golden decades with brilliant gold price rises: After the previous two golden decades, the 1970s and the 2000s, we are now in the middle of the third golden decade. Setbacks and longer pauses to catch your breath cannot be ruled out in a secular bull market and are even beneficial for long-term development. Such phases are suitable for additional purchases. Fundamentally, there is much to suggest that the 2020s will once again be a golden decade, not just a golden half-decade.
Against this backdrop, the new 60/40 portfolio presented last year not only remains relevant but also proves to be a strategically well-thought-out response to the requirements of an increasingly complex market environment. It combines sound money principles and reflects the insight that runs through all bull markets, as the historical pattern suggests: the first half builds up, the second escalates, and the curtain finally falls in the middle of the applause.
Tyler Durden
Fri, 07/25/2025 – 08:05